Estimated Value: $437,000 - $462,000
3
Beds
1
Bath
1,688
Sq Ft
$266/Sq Ft
Est. Value
About This Home
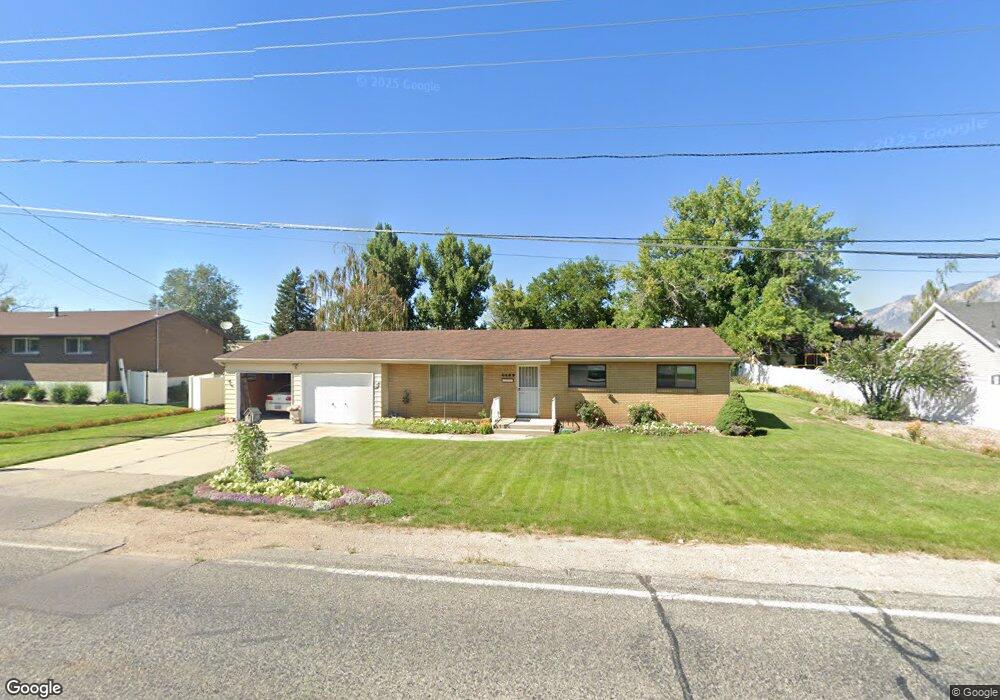
This home is located at 4462 W 1975 N, Ogden, UT 84404 and is currently estimated at $448,836, approximately $265 per square foot. 4462 W 1975 N is a home located in Weber County with nearby schools including Plain City School, Wahlquist Junior High School, and Fremont High School.
Ownership History
Date
Name
Owned For
Owner Type
Purchase Details
Closed on
Oct 3, 2024
Sold by
Lewis Kristine and Parke Konnie
Bought by
Arrington Michael Dean and Arrington Jorielle Ruth
Current Estimated Value
Home Financials for this Owner
Home Financials are based on the most recent Mortgage that was taken out on this home.
Original Mortgage
$342,000
Outstanding Balance
$337,816
Interest Rate
6.46%
Mortgage Type
New Conventional
Estimated Equity
$111,020
Purchase Details
Closed on
Oct 17, 2011
Sold by
Lund Keith Lee and Lund Keith L
Bought by
Lund Keith Lee and Lewis Kristine
Create a Home Valuation Report for This Property
The Home Valuation Report is an in-depth analysis detailing your home's value as well as a comparison with similar homes in the area
Home Values in the Area
Average Home Value in this Area
Purchase History
| Date | Buyer | Sale Price | Title Company |
|---|---|---|---|
| Arrington Michael Dean | -- | Backman Title | |
| Lund Keith Lee | -- | None Available |
Source: Public Records
Mortgage History
| Date | Status | Borrower | Loan Amount |
|---|---|---|---|
| Open | Arrington Michael Dean | $342,000 |
Source: Public Records
Tax History
| Year | Tax Paid | Tax Assessment Tax Assessment Total Assessment is a certain percentage of the fair market value that is determined by local assessors to be the total taxable value of land and additions on the property. | Land | Improvement |
|---|---|---|---|---|
| 2025 | $2,250 | $384,577 | $156,134 | $228,443 |
| 2024 | $2,152 | $208,449 | $85,870 | $122,579 |
| 2023 | $2,018 | $194,700 | $77,652 | $117,048 |
| 2022 | $2,025 | $201,850 | $74,801 | $127,049 |
| 2021 | $1,745 | $288,000 | $65,771 | $222,229 |
| 2020 | $1,675 | $254,000 | $55,666 | $198,334 |
| 2019 | $1,610 | $229,000 | $50,493 | $178,507 |
| 2018 | $1,498 | $201,000 | $50,493 | $150,507 |
| 2017 | $1,328 | $165,000 | $44,377 | $120,623 |
| 2016 | $1,317 | $90,159 | $22,155 | $68,004 |
| 2015 | $1,301 | $86,997 | $22,155 | $64,842 |
| 2014 | $1,228 | $79,630 | $23,246 | $56,384 |
Source: Public Records
Map
Nearby Homes
- 1980 N 4650 W
- 2131 N 4650 W
- 4236 W 2200 N
- 4479 W 1650 N
- 4494 W 1600 N
- 4096 W 1725 N
- 1862 N 3900 W
- 3782 W 2100 N
- 2316 N 3825 W
- 2771 N 4200 W
- 2752 W 2775 N Unit 150
- 2746 W 2775 N Unit 149
- 3855 W 2600 N
- 2255 N 3600 St W Unit 21
- 4188 W 2875 N
- 3940 2800 North St
- 3424 W Pioneer Rd
- 2994 W 1975 N
- 2950 W 1975 N
- 2287 N 2850 W
Your Personal Tour Guide
Ask me questions while you tour the home.