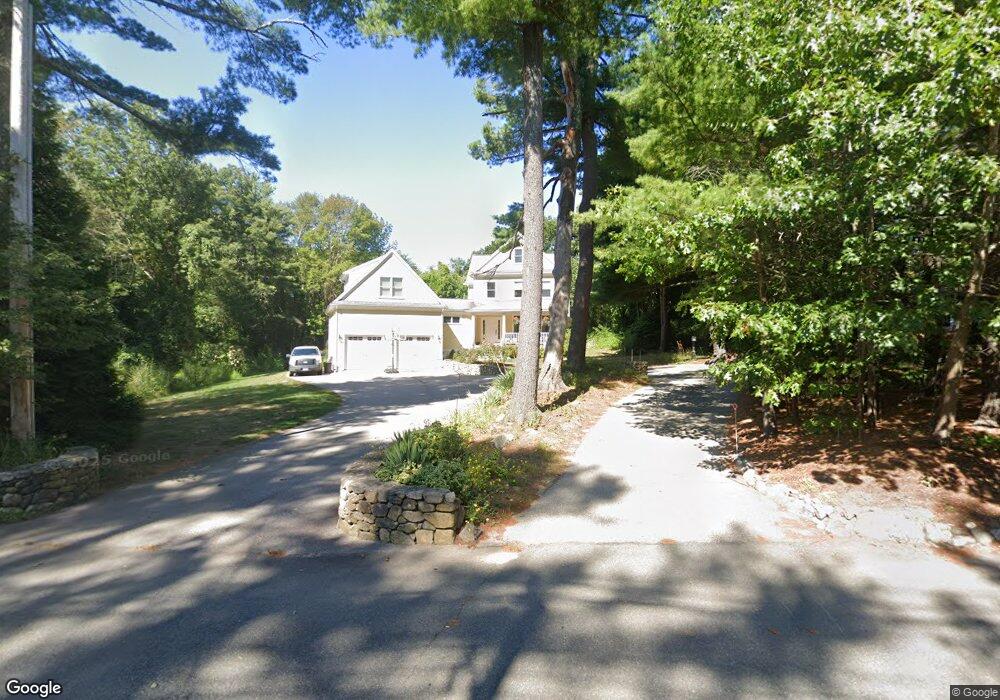
447 Cushing St Hingham, MA 02043
South Hingham NeighborhoodEstimated Value: $1,045,000 - $2,010,000
2
Beds
1
Bath
1,200
Sq Ft
$1,408/Sq Ft
Est. Value
About This Home
This home is located at 447 Cushing St, Hingham, MA 02043 and is currently estimated at $1,689,804, approximately $1,408 per square foot. 447 Cushing St is a home located in Plymouth County with nearby schools including South Elementary School, Hingham Middle School, and Hingham High School.
Ownership History
Date
Name
Owned For
Owner Type
Purchase Details
Closed on
Jan 3, 2017
Sold by
Collins Patricia A and Collins Timothy J
Bought by
James J Gadsiac Klim T
Current Estimated Value
Purchase Details
Closed on
Jun 30, 2005
Sold by
Hecox Rebecca and Hecox Mark
Bought by
Collins Patricia A and Collins Timothy J
Purchase Details
Closed on
Dec 18, 1996
Sold by
Dolan Robert W
Bought by
Hecox Mark and Hecox Rebecca
Purchase Details
Closed on
Oct 26, 1994
Sold by
Mcabee William and Mcabee Jennifer H
Bought by
Dolan Robert W
Purchase Details
Closed on
Oct 27, 1987
Sold by
Jacobus Robert T
Bought by
Mcabee William
Create a Home Valuation Report for This Property
The Home Valuation Report is an in-depth analysis detailing your home's value as well as a comparison with similar homes in the area
Home Values in the Area
Average Home Value in this Area
Purchase History
| Date | Buyer | Sale Price | Title Company |
|---|---|---|---|
| James J Gadsiac Klim T | -- | -- | |
| Collins Patricia A | $380,000 | -- | |
| Hecox Mark | $184,375 | -- | |
| Dolan Robert W | $178,000 | -- | |
| Mcabee William | $177,000 | -- |
Source: Public Records
Mortgage History
| Date | Status | Borrower | Loan Amount |
|---|---|---|---|
| Previous Owner | Mcabee William | $87,000 | |
| Previous Owner | Mcabee William | $196,250 |
Source: Public Records
Tax History
| Year | Tax Paid | Tax Assessment Tax Assessment Total Assessment is a certain percentage of the fair market value that is determined by local assessors to be the total taxable value of land and additions on the property. | Land | Improvement |
|---|---|---|---|---|
| 2025 | $16,626 | $1,555,300 | $464,700 | $1,090,600 |
| 2024 | $14,378 | $1,325,200 | $464,700 | $860,500 |
| 2023 | $12,834 | $1,283,400 | $464,700 | $818,700 |
| 2022 | $14,438 | $1,249,000 | $396,800 | $852,200 |
| 2021 | $13,608 | $1,153,200 | $396,800 | $756,400 |
| 2020 | $13,296 | $1,153,200 | $396,800 | $756,400 |
| 2019 | $13,032 | $1,103,500 | $396,800 | $706,700 |
| 2018 | $11,831 | $1,005,200 | $396,800 | $608,400 |
| 2017 | $11,533 | $941,500 | $381,100 | $560,400 |
| 2016 | $11,535 | $923,500 | $363,100 | $560,400 |
| 2015 | $11,355 | $906,200 | $345,800 | $560,400 |
Source: Public Records
Map
Nearby Homes
- 18 Whiting Ln
- 183 Gardner St
- 4 Kerri Ln
- 1 Kerri Ln
- 100 Whiting St
- 5 Old County Rd
- 17 Pine Haven Cir
- 13 Independence Ln
- 1276 Washington St Unit A
- 1272 Washington St Unit G
- 22 Longmeadow Rd
- 2 Black Rock Dr Unit 21
- 2 Black Rock Dr
- 16 Stacey Way
- 1 Elizabeth Ln Unit 1
- 3 Elizabeth Ln Unit 3
- 5 Elizabeth Ln Unit 5
- 7 Elizabeth Ln Unit 7
- 9 Elizabeth Ln Unit 9
- 13 Elizabeth Ln Unit 13
Your Personal Tour Guide
Ask me questions while you tour the home.