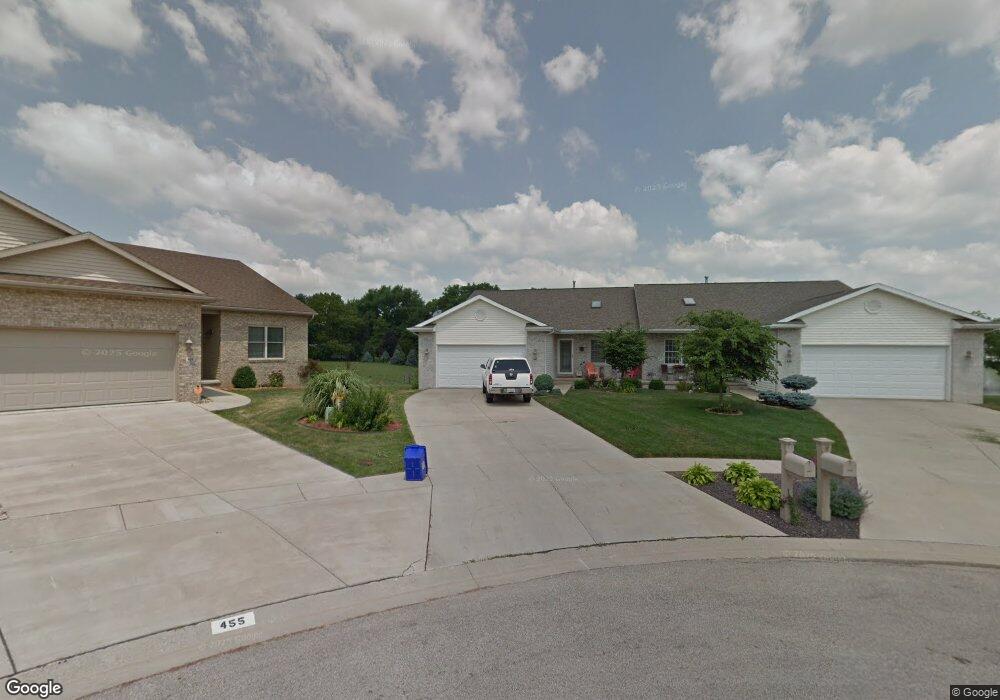
447 Elle Ct Springfield, IL 62711
Estimated Value: $265,429 - $380,000
2
Beds
2
Baths
1,628
Sq Ft
$194/Sq Ft
Est. Value
About This Home
This home is located at 447 Elle Ct, Springfield, IL 62711 and is currently estimated at $316,607, approximately $194 per square foot. 447 Elle Ct is a home located in Sangamon County with nearby schools including Farmingdale Elementary School, Pleasant Plains Middle School, and Pleasant Plains High School.
Ownership History
Date
Name
Owned For
Owner Type
Purchase Details
Closed on
Nov 24, 2010
Current Estimated Value
Purchase Details
Closed on
Nov 10, 2010
Purchase Details
Closed on
Mar 14, 2008
Purchase Details
Closed on
Dec 18, 2007
Purchase Details
Closed on
Dec 13, 2007
Purchase Details
Closed on
Oct 12, 2007
Purchase Details
Closed on
Oct 9, 2007
Purchase Details
Closed on
Feb 2, 2007
Create a Home Valuation Report for This Property
The Home Valuation Report is an in-depth analysis detailing your home's value as well as a comparison with similar homes in the area
Purchase History
| Date | Buyer | Sale Price | Title Company |
|---|---|---|---|
| -- | $172,500 | -- | |
| -- | -- | -- | |
| -- | $148,000 | -- | |
| -- | -- | -- | |
| -- | $140,000 | -- | |
| -- | -- | -- | |
| -- | $450,000 | -- | |
| -- | -- | -- |
Source: Public Records
Tax History
| Year | Tax Paid | Tax Assessment Tax Assessment Total Assessment is a certain percentage of the fair market value that is determined by local assessors to be the total taxable value of land and additions on the property. | Land | Improvement |
|---|---|---|---|---|
| 2024 | $5,404 | $80,384 | $12,971 | $67,413 |
| 2023 | $5,148 | $74,498 | $12,021 | $62,477 |
| 2022 | $4,850 | $69,495 | $11,214 | $58,281 |
| 2021 | $4,627 | $66,521 | $10,734 | $55,787 |
| 2020 | $4,537 | $65,197 | $10,520 | $54,677 |
| 2019 | $4,470 | $64,846 | $10,463 | $54,383 |
| 2018 | $4,626 | $65,409 | $10,554 | $54,855 |
| 2017 | $4,503 | $64,258 | $10,368 | $53,890 |
| 2016 | $4,349 | $62,109 | $10,021 | $52,088 |
| 2015 | $4,209 | $59,721 | $9,636 | $50,085 |
| 2014 | $4,137 | $58,908 | $9,505 | $49,403 |
| 2013 | $4,143 | $59,323 | $9,572 | $49,751 |
Source: Public Records
Map
Nearby Homes
Your Personal Tour Guide
Ask me questions while you tour the home.