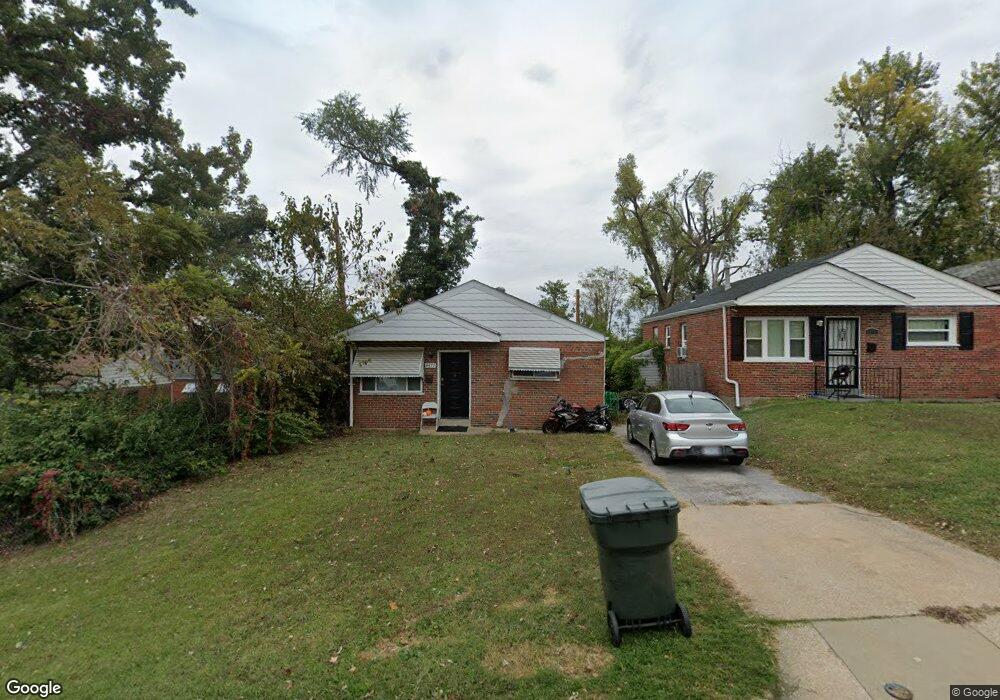
4477 Anderson Ave Saint Louis, MO 63115
Penrose NeighborhoodEstimated Value: $47,361 - $79,000
Studio
1
Bath
1,810
Sq Ft
$35/Sq Ft
Est. Value
About This Home
This home is located at 4477 Anderson Ave, Saint Louis, MO 63115 and is currently estimated at $64,090, approximately $35 per square foot. 4477 Anderson Ave is a home located in St. Louis City with nearby schools including Ashland Elementary School, Yeatman-Liddell Middle School, and Vashon High School.
Ownership History
Date
Name
Owned For
Owner Type
Purchase Details
Closed on
Mar 15, 2019
Sold by
Mckinney Felicia E
Bought by
Rogers Janett
Current Estimated Value
Purchase Details
Closed on
Apr 15, 2014
Sold by
Rogers Felicia E
Bought by
Mckinney Felicia E
Purchase Details
Closed on
Dec 1, 1997
Sold by
Mark S Mehlman Realty Inc
Bought by
Rogers Felicia E
Home Financials for this Owner
Home Financials are based on the most recent Mortgage that was taken out on this home.
Original Mortgage
$40,388
Interest Rate
7.18%
Mortgage Type
FHA
Purchase Details
Closed on
Jan 17, 1997
Sold by
Minor Thomas W and Minor Dorothy
Bought by
Mark S Mehlman Realty Inc
Home Financials for this Owner
Home Financials are based on the most recent Mortgage that was taken out on this home.
Original Mortgage
$20,000
Interest Rate
7.43%
Mortgage Type
Purchase Money Mortgage
Create a Home Valuation Report for This Property
The Home Valuation Report is an in-depth analysis detailing your home's value as well as a comparison with similar homes in the area
Home Values in the Area
Average Home Value in this Area
Purchase History
| Date | Buyer | Sale Price | Title Company |
|---|---|---|---|
| Rogers Janett | $4,200 | None Available | |
| Mckinney Felicia E | -- | None Available | |
| Rogers Felicia E | -- | -- | |
| Mark S Mehlman Realty Inc | -- | -- | |
| Minor Thomas William | -- | -- |
Source: Public Records
Mortgage History
| Date | Status | Borrower | Loan Amount |
|---|---|---|---|
| Previous Owner | Rogers Felicia E | $40,388 | |
| Previous Owner | Mark S Mehlman Realty Inc | $20,000 |
Source: Public Records
Tax History
| Year | Tax Paid | Tax Assessment Tax Assessment Total Assessment is a certain percentage of the fair market value that is determined by local assessors to be the total taxable value of land and additions on the property. | Land | Improvement |
|---|---|---|---|---|
| 2025 | $308 | $3,460 | $360 | $3,100 |
| 2024 | $294 | $3,340 | $360 | $2,980 |
| 2023 | $294 | $3,340 | $360 | $2,980 |
| 2022 | $300 | $3,290 | $360 | $2,930 |
| 2021 | $300 | $3,290 | $360 | $2,930 |
| 2020 | $297 | $3,290 | $360 | $2,930 |
| 2019 | $297 | $3,290 | $360 | $2,930 |
| 2018 | $297 | $3,190 | $360 | $2,830 |
| 2017 | $292 | $3,190 | $360 | $2,830 |
| 2016 | $377 | $4,160 | $720 | $3,440 |
| 2015 | $344 | $4,160 | $720 | $3,440 |
| 2014 | $413 | $4,160 | $720 | $3,440 |
| 2013 | -- | $5,070 | $720 | $4,350 |
Source: Public Records
Map
Nearby Homes
- 4470 Bessie Ave
- 4414 Dryden Ave
- 4418 Dryden Ave
- 4464 Lee Ave
- 4402 Clarence Ave
- 4110 Dryden Ave
- 4410 Marcus Ave
- 4330 Penrose St
- 4210 Holly Ave
- 4470 Clarence Ave
- 4223 Athlone Ave
- 4608 Pope Ave
- 3003 TAYOR N Taylor Ave
- 4655 Farlin Ave
- 4115 Turner Ave
- 4453 Athlone Ave
- 4537 Clarence Ave
- 4219 Red Bud Ave
- 4341 Shreve Ave
- 4215 Shreve Ave
- 4306 N Taylor Ave
- 4312 N Taylor Ave
- 4475 Anderson Ave
- 4318 N Taylor Ave
- 4300 N Taylor Ave
- 4471 Anderson Ave
- 4324 N Taylor Ave
- 4330 N Taylor Ave
- 4469 Anderson Ave
- 4467 Anderson Ave
- 4482 Anderson Ave
- 4480 Anderson Ave
- 4484 Anderson Ave
- 4476 Anderson Ave
- 4486 Anderson Ave
- 4336 N Taylor Ave
- 4472 Anderson Ave
- 4490 Anderson Ave
- 4468 Anderson Ave
- 4503 Anderson Ave
Your Personal Tour Guide
Ask me questions while you tour the home.