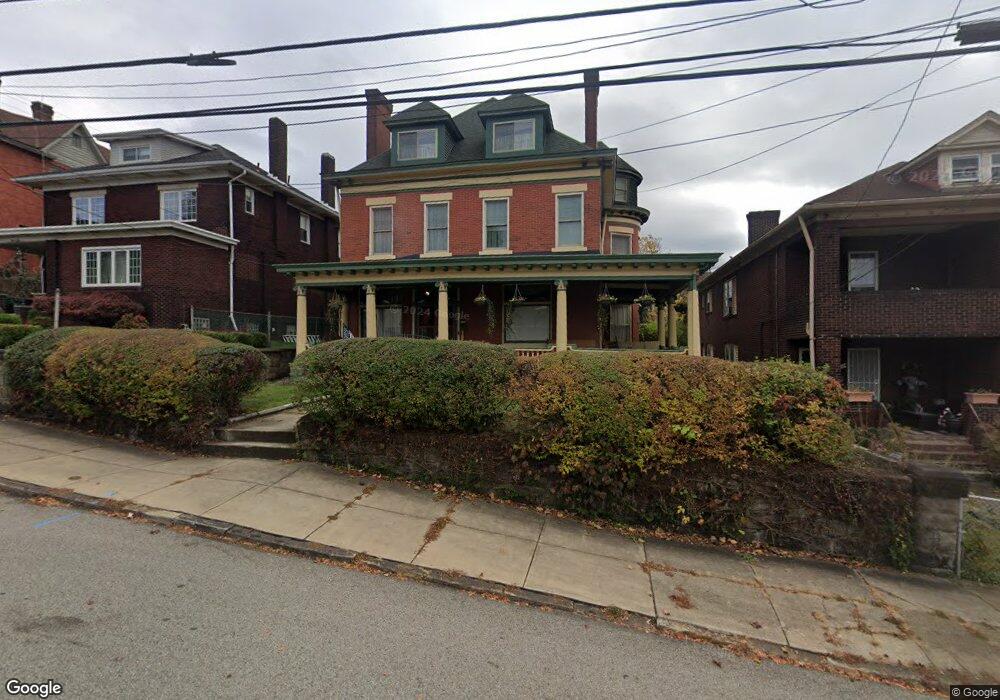
448 2nd St Braddock, PA 15104
Estimated Value: $129,000 - $242,000
6
Beds
3
Baths
3,278
Sq Ft
$55/Sq Ft
Est. Value
About This Home
This home is located at 448 2nd St, Braddock, PA 15104 and is currently estimated at $179,803, approximately $54 per square foot. 448 2nd St is a home located in Allegheny County with nearby schools including Woodland Hills Senior High School, Braddock Hills High School, and Universal Academy Of Pittsburgh.
Ownership History
Date
Name
Owned For
Owner Type
Purchase Details
Closed on
May 30, 2023
Sold by
Richeson Laura L and Zinski Laura Richeson
Bought by
Zinski Laura Richeson and Zinski Ronald Alan
Current Estimated Value
Purchase Details
Closed on
May 23, 2023
Sold by
Richeson Laura and Richeson Zinski Laura
Bought by
Zinski Laura and Zinski Ronald Alan
Purchase Details
Closed on
Sep 4, 1996
Sold by
Herman Joseph H and Herman Laura L
Bought by
Richeson Laura L
Create a Home Valuation Report for This Property
The Home Valuation Report is an in-depth analysis detailing your home's value as well as a comparison with similar homes in the area
Home Values in the Area
Average Home Value in this Area
Purchase History
We collect this data history from publicly available records. To have your information removed, we recommend requesting removal directly through your county’s website.
| Date | Buyer | Sale Price | Title Company |
|---|---|---|---|
| Zinski Laura | -- | -- | |
| Richeson Laura L | $58,000 | -- | |
| Zinski Laura Richeson | -- | -- |
Source: Public Records
Tax History
| Year | Tax Paid | Tax Assessment Tax Assessment Total Assessment is a certain percentage of the fair market value that is determined by local assessors to be the total taxable value of land and additions on the property. | Land | Improvement |
|---|---|---|---|---|
| 2025 | $3,133 | $69,800 | $4,100 | $65,700 |
| 2024 | $3,133 | $69,800 | $4,100 | $65,700 |
| 2023 | $3,167 | $69,800 | $4,100 | $65,700 |
| 2022 | $3,167 | $69,800 | $4,100 | $65,700 |
| 2021 | $330 | $69,800 | $4,100 | $65,700 |
| 2020 | $3,105 | $69,800 | $4,100 | $65,700 |
| 2019 | $3,052 | $69,800 | $4,100 | $65,700 |
| 2018 | $330 | $69,800 | $4,100 | $65,700 |
| 2017 | $2,983 | $69,800 | $4,100 | $65,700 |
| 2016 | $330 | $69,800 | $4,100 | $65,700 |
| 2015 | $330 | $69,800 | $4,100 | $65,700 |
| 2014 | $2,707 | $69,800 | $4,100 | $65,700 |
Source: Public Records
Map
Nearby Homes
Your Personal Tour Guide
Ask me questions while you tour the home.