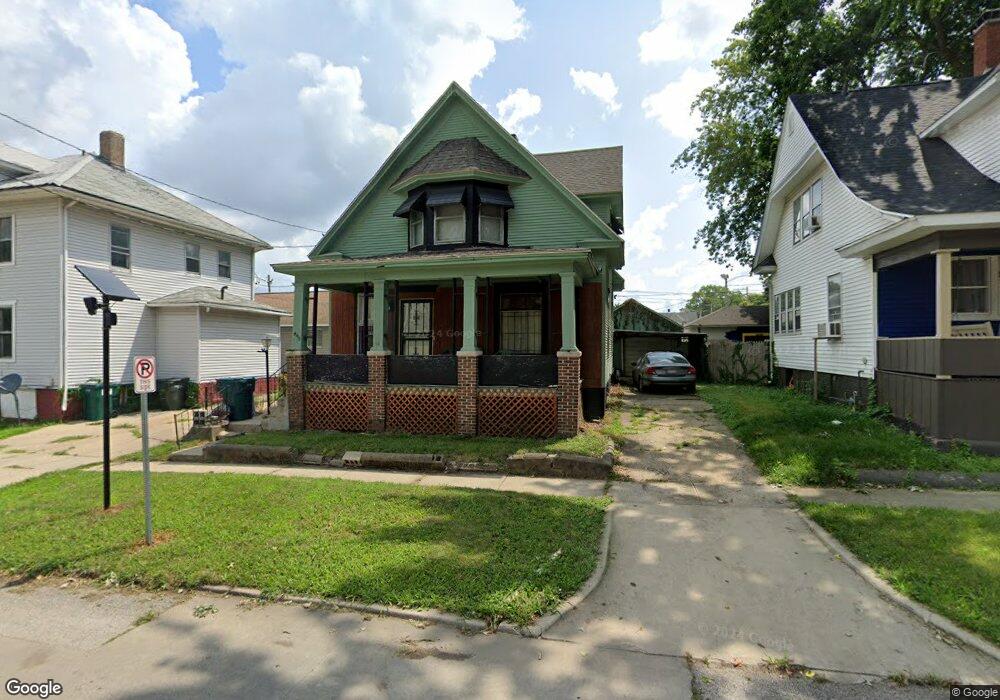
448 N Pine St Decatur, IL 62522
Millikin Home NeighborhoodEstimated Value: $37,606 - $54,000
Studio
--
Bath
864
Sq Ft
$53/Sq Ft
Est. Value
About This Home
This home is located at 448 N Pine St, Decatur, IL 62522 and is currently estimated at $46,152, approximately $53 per square foot. 448 N Pine St is a home located in Macon County with nearby schools including Dennis Lab School, St. Patrick School, and Teen Challenge-Home For Girls.
Ownership History
Date
Name
Owned For
Owner Type
Purchase Details
Closed on
Mar 3, 2011
Sold by
Hale Carolyn Sue
Bought by
May Keith and May Mary
Current Estimated Value
Create a Home Valuation Report for This Property
The Home Valuation Report is an in-depth analysis detailing your home's value as well as a comparison with similar homes in the area
Home Values in the Area
Average Home Value in this Area
Purchase History
| Date | Buyer | Sale Price | Title Company |
|---|---|---|---|
| May Keith | -- | None Available |
Source: Public Records
Tax History
| Year | Tax Paid | Tax Assessment Tax Assessment Total Assessment is a certain percentage of the fair market value that is determined by local assessors to be the total taxable value of land and additions on the property. | Land | Improvement |
|---|---|---|---|---|
| 2024 | -- | $12,674 | $1,195 | $11,479 |
| 2023 | -- | $12,226 | $1,153 | $11,073 |
| 2022 | $10 | $11,313 | $1,067 | $10,246 |
| 2021 | $87 | $10,566 | $997 | $9,569 |
| 2020 | $142 | $10,075 | $950 | $9,125 |
| 2019 | $142 | $10,075 | $950 | $9,125 |
| 2018 | $140 | $10,108 | $953 | $9,155 |
| 2017 | $664 | $10,377 | $978 | $9,399 |
| 2016 | $670 | $10,483 | $988 | $9,495 |
| 2015 | $648 | $10,298 | $971 | $9,327 |
| 2014 | $607 | $10,196 | $961 | $9,235 |
| 2013 | $605 | $10,579 | $997 | $9,582 |
Source: Public Records
Map
Nearby Homes
- 254 N Pine St
- 609 W William St
- 717 W Prairie Ave Unit 2
- 958 W William St
- 979 W Cerro Gordo St
- 442 W Prairie Ave
- 555 W Main St
- 233 N Edward St
- 899 W Main St
- 960 W Green St
- 657 W Wood St
- 1005 W Main St
- 281 W Prairie Ave
- 1097 W Green St
- 233 S Edward St
- 428 Powers Ln
- 314 W Decatur St
- 357 W Decatur St
- 1034 N Oakland Ave
- 527 S Boyd St
- 440 N Pine St
- 755 W Eldorado St
- 755 W Eldorado St Unit 1
- 745 W Eldorado St
- 430 N Pine St
- 801 W Eldorado St
- 803 W Eldorado St
- 807 W Eldorado St
- 736 W North St
- 701 W Eldorado St
- 728 W North St
- 748 W North St
- 427 N Mercer St
- 809 W Eldorado St
- 419 N Mercer St
- 716 W North St
- 815 W Eldorado St
- 411 N Mercer St
- 405 N Mercer St
- 450 N Mercer St
Your Personal Tour Guide
Ask me questions while you tour the home.