449 Broadway Pawtucket, RI 02860
Pleasant View NeighborhoodEstimated Value: $1,008,943
About This Home
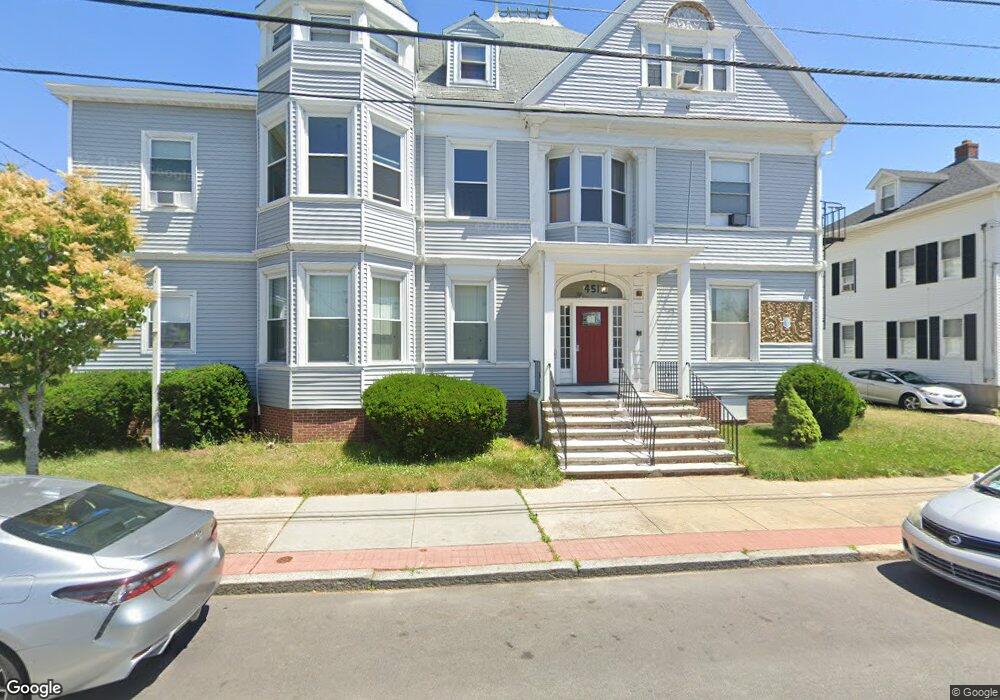
This home is located at 449 Broadway, Pawtucket, RI 02860 and is currently estimated at $1,008,943, approximately $67 per square foot. 449 Broadway is a home located in Providence County with nearby schools including St Cecilia School and Saint Raphael Academy.
Ownership History
We collect this data history from publicly available records. To have your information removed, we recommend requesting removal directly through your county’s website.
Purchase Details
Home Financials for this Owner
Home Financials are based on the most recent Mortgage that was taken out on this home.Purchase Details
Purchase Details
Purchase Details
Purchase Details
Home Values in the Area
Average Home Value in this Area
Purchase History
We collect this data history from publicly available records. To have your information removed, we recommend requesting removal directly through your county’s website.
| Date | Buyer | Sale Price | Title Company |
|---|---|---|---|
| $400,000 | -- | ||
| $500,000 | -- | ||
| $1,864 | -- | ||
| $1,435 | -- | ||
| $1,435 | -- |
Mortgage History
We collect this data history from publicly available records. To have your information removed, we recommend requesting removal directly through your county’s website.
| Date | Status | Borrower | Loan Amount |
|---|---|---|---|
| Open | $300,000 | ||
| Previous Owner | $400,000 |
Tax History
We collect this data history from publicly available records. To have your information removed, we recommend requesting removal directly through your county’s website.
| Year | Tax Paid | Tax Assessment Tax Assessment Total Assessment is a certain percentage of the fair market value that is determined by local assessors to be the total taxable value of land and additions on the property. | Land | Improvement |
|---|---|---|---|---|
| 2025 | $9,185 | $698,500 | $94,300 | $604,200 |
| 2024 | -- | $698,500 | $94,300 | $604,200 |
| 2023 | $0 | $547,500 | $78,400 | $469,100 |
| 2022 | $0 | $547,500 | $78,400 | $469,100 |
| 2021 | $0 | $547,500 | $78,400 | $469,100 |
| 2020 | $0 | $523,700 | $78,400 | $445,300 |
| 2019 | $12,078 | $523,700 | $78,400 | $445,300 |
| 2018 | $0 | $523,700 | $78,400 | $445,300 |
| 2017 | $0 | $511,000 | $80,400 | $430,600 |
| 2016 | -- | $511,000 | $80,400 | $430,600 |
| 2015 | -- | $511,000 | $80,400 | $430,600 |
| 2014 | -- | $552,400 | $87,400 | $465,000 |
Map
- 153 Central Ave
- 38 Lawrence St
- 300 Front St Unit 105
- 300 Front St Unit 512
- 35 Allen Ave
- 50 Primrose St
- 46 Lilac St
- 211 Carnation St
- 39 Locust St
- 163 Park St
- 32 Gooding St
- 150 N Bend St
- 404 Roosevelt Ave Unit 204G
- 58 Myrtle St
- 511 High St
- 50 Mavis St Unit 1
- 517 High St
- 39 Webster St Unit 101
- 107 Spring St
- 34 Appleton Ave
Ask me questions while you tour the home.