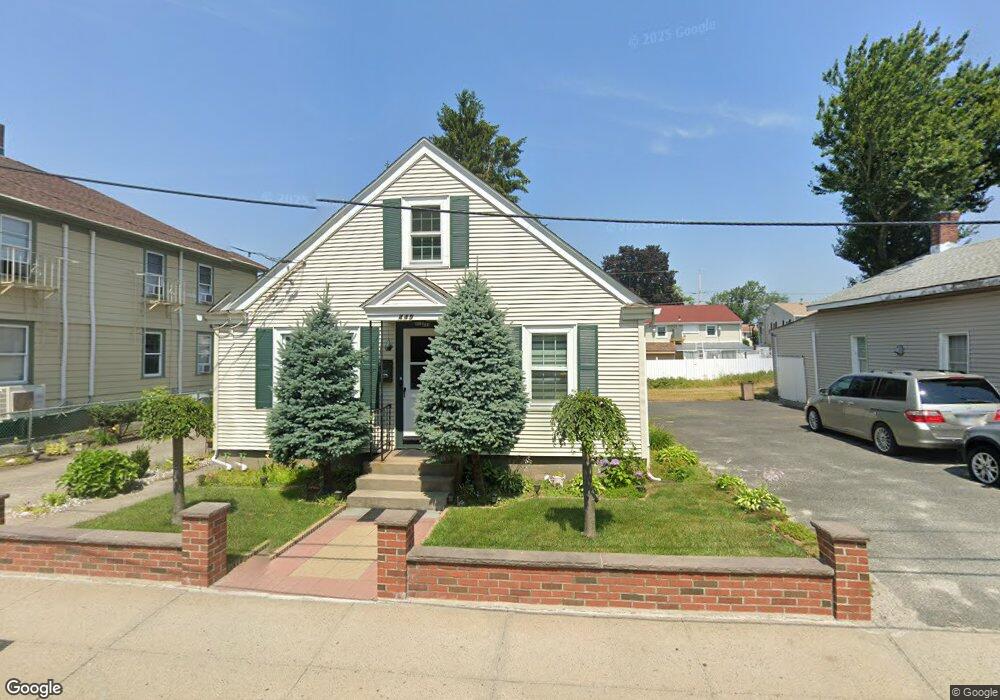
449 Hunt St Central Falls, RI 02863
Estimated Value: $349,000 - $392,129
About This Home
This home is located at 449 Hunt St, Central Falls, RI 02863 and is currently estimated at $374,282, approximately $215 per square foot. 449 Hunt St is a home located in Providence County with nearby schools including Central Falls Senior High School, Blackstone Valley Prep Elementary School 2, and Blackstone Valley Prep Elementary School 1.
Ownership History
We collect this data history from publicly available records. To have your information removed, we recommend requesting removal directly through your county’s website.
Purchase Details
Home Financials for this Owner
Home Financials are based on the most recent Mortgage that was taken out on this home.Home Values in the Area
Average Home Value in this Area
Purchase History
We collect this data history from publicly available records. To have your information removed, we recommend requesting removal directly through your county’s website.
| Date | Buyer | Sale Price | Title Company |
|---|---|---|---|
| $118,000 | -- |
Mortgage History
We collect this data history from publicly available records. To have your information removed, we recommend requesting removal directly through your county’s website.
| Date | Status | Borrower | Loan Amount |
|---|---|---|---|
| Open | $80,000 | ||
| Closed | $94,400 |
Tax History
We collect this data history from publicly available records. To have your information removed, we recommend requesting removal directly through your county’s website.
| Year | Tax Paid | Tax Assessment Tax Assessment Total Assessment is a certain percentage of the fair market value that is determined by local assessors to be the total taxable value of land and additions on the property. | Land | Improvement |
|---|---|---|---|---|
| 2025 | $4,255 | $322,100 | $105,000 | $217,100 |
| 2024 | $4,560 | $242,400 | $79,500 | $162,900 |
| 2023 | $4,497 | $242,400 | $79,500 | $162,900 |
| 2022 | $2,909 | $242,400 | $79,500 | $162,900 |
| 2021 | $3,547 | $149,300 | $27,500 | $121,800 |
| 2020 | $3,537 | $149,300 | $27,500 | $121,800 |
| 2019 | $3,697 | $149,300 | $27,500 | $121,800 |
| 2018 | $3,694 | $140,400 | $26,500 | $113,900 |
| 2017 | $3,694 | $140,400 | $26,500 | $113,900 |
| 2016 | $3,641 | $140,400 | $26,500 | $113,900 |
| 2015 | $3,821 | $138,300 | $25,000 | $113,300 |
| 2014 | $3,770 | $138,300 | $25,000 | $113,300 |
| 2013 | $3,557 | $138,300 | $25,000 | $113,300 |
Map
- 443 Hunt St
- 453 Hunt St Unit 455
- 439 Hunt St
- 170 Shawmut Ave
- 413 Hunt St
- 413 Hunt St Unit B
- 174 Shawmut Ave
- 441 Hunt St
- 180 Shawmut Ave Unit 182
- 423 Hunt St Unit 425
- 162 Shawmut Ave
- 433 Hunt St
- 184 Shawmut Ave
- 156 Shawmut Ave
- 153 Shawmut Ave
- 0 Shawmut Ave
- 473 Hunt St Unit 475
- 150 Shawmut Ave
- 97 Richmond St
- 419 Hunt St
Ask me questions while you tour the home.