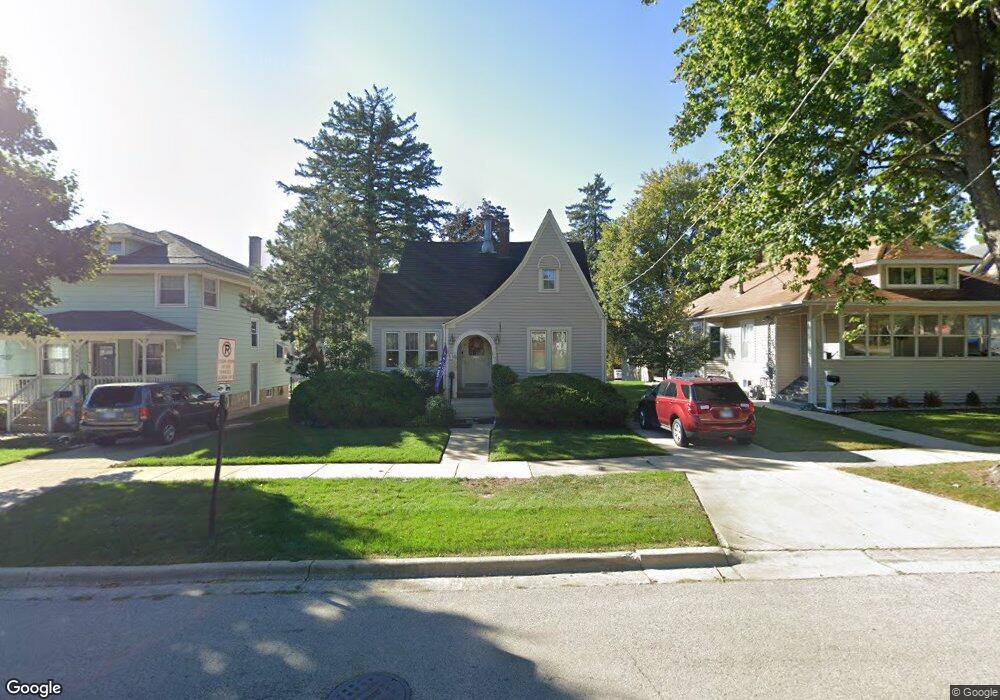
449 Morgan St Elgin, IL 60123
Southwest Elgin NeighborhoodEstimated Value: $257,392 - $273,000
2
Beds
1
Bath
1,511
Sq Ft
$178/Sq Ft
Est. Value
About This Home
This home is located at 449 Morgan St, Elgin, IL 60123 and is currently estimated at $268,348, approximately $177 per square foot. 449 Morgan St is a home located in Kane County with nearby schools including Lowrie Elementary School, Abbott Middle School, and Larkin High School.
Ownership History
Date
Name
Owned For
Owner Type
Purchase Details
Closed on
Dec 22, 2010
Sold by
Marco Edgar J
Bought by
Marco Edgar J and Marco Diane
Current Estimated Value
Home Financials for this Owner
Home Financials are based on the most recent Mortgage that was taken out on this home.
Original Mortgage
$193,625
Interest Rate
4.84%
Mortgage Type
New Conventional
Create a Home Valuation Report for This Property
The Home Valuation Report is an in-depth analysis detailing your home's value as well as a comparison with similar homes in the area
Home Values in the Area
Average Home Value in this Area
Purchase History
| Date | Buyer | Sale Price | Title Company |
|---|---|---|---|
| Marco Edgar J | -- | Citywide Title Corporation |
Source: Public Records
Mortgage History
| Date | Status | Borrower | Loan Amount |
|---|---|---|---|
| Closed | Marco Edgar J | $193,625 |
Source: Public Records
Tax History
| Year | Tax Paid | Tax Assessment Tax Assessment Total Assessment is a certain percentage of the fair market value that is determined by local assessors to be the total taxable value of land and additions on the property. | Land | Improvement |
|---|---|---|---|---|
| 2024 | $4,360 | $72,478 | $14,313 | $58,165 |
| 2023 | $4,047 | $65,479 | $12,931 | $52,548 |
| 2022 | $4,223 | $59,706 | $11,791 | $47,915 |
| 2021 | $3,999 | $55,821 | $11,024 | $44,797 |
| 2020 | $3,857 | $53,290 | $10,524 | $42,766 |
| 2019 | $3,714 | $50,762 | $10,025 | $40,737 |
| 2018 | $3,429 | $45,680 | $9,444 | $36,236 |
| 2017 | $3,310 | $43,184 | $8,928 | $34,256 |
| 2016 | $3,100 | $40,063 | $8,283 | $31,780 |
| 2015 | -- | $36,721 | $7,592 | $29,129 |
| 2014 | -- | $36,267 | $7,498 | $28,769 |
| 2013 | -- | $37,224 | $7,696 | $29,528 |
Source: Public Records
Map
Nearby Homes
- 331 Orange St
- 453 Orchard St
- 224 Moseley St
- 462 Ashland Ave
- 133 Oak St
- 208 Moseley St
- 3 National St Unit 3
- 7 National St Unit 7
- 315 Vandalia St
- 756 Walnut Ave
- 835 Oak St
- 761 South St
- 400 Marguerite St
- 118 S Union St
- 532 South St
- 96 S Crystal St
- 118 Wilcox Ave
- 50 Sheridan St
- 162 Festival Ct
- 9 N Jackson St
Your Personal Tour Guide
Ask me questions while you tour the home.