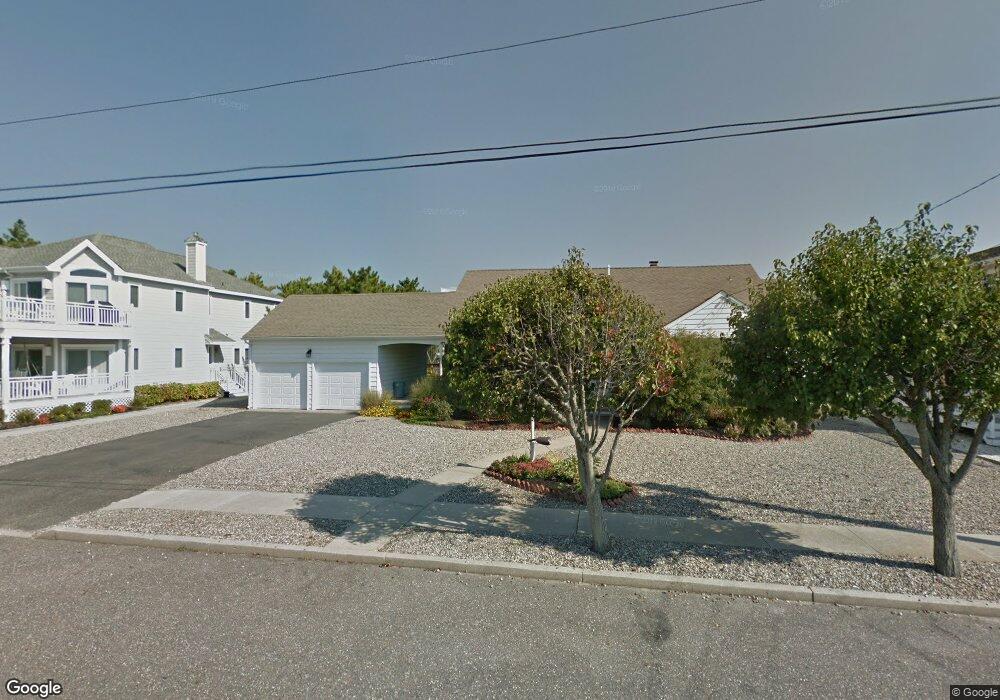
45 19th St E Avalon, NJ 08202
Estimated Value: $2,702,000 - $4,351,000
Studio
--
Bath
2,270
Sq Ft
$1,593/Sq Ft
Est. Value
About This Home
This home is located at 45 19th St E, Avalon, NJ 08202 and is currently estimated at $3,616,039, approximately $1,592 per square foot. 45 19th St E is a home located in Cape May County with nearby schools including Avalon Elementary School.
Ownership History
Date
Name
Owned For
Owner Type
Purchase Details
Closed on
Dec 30, 2024
Sold by
Gorelick Robert and Gorelick David
Bought by
Gorelick Henry and Gorelick Marion
Current Estimated Value
Purchase Details
Closed on
Oct 19, 2024
Sold by
Henry Gorelick Qualified Personal Reside and Gorelick Marion
Bought by
Gorelick Robert and Gorelick David
Purchase Details
Closed on
Jul 31, 2012
Sold by
Gorelick Marion
Bought by
Gorelick Henry
Purchase Details
Closed on
Jul 17, 2012
Sold by
Gorelick Henry and Gorelick Marion
Bought by
Gorelick Henry and Gorelick Marion
Create a Home Valuation Report for This Property
The Home Valuation Report is an in-depth analysis detailing your home's value as well as a comparison with similar homes in the area
Home Values in the Area
Average Home Value in this Area
Purchase History
| Date | Buyer | Sale Price | Title Company |
|---|---|---|---|
| Gorelick Henry | -- | None Listed On Document | |
| Gorelick Robert | -- | None Listed On Document | |
| Gorelick Robert | -- | None Listed On Document | |
| Gorelick Robert | -- | None Listed On Document | |
| Gorelick Robert | -- | None Listed On Document | |
| Gorelick Robert | -- | None Listed On Document | |
| Gorelick Henry | -- | None Available | |
| Gorelick Marion | -- | None Available | |
| Gorelick Henry | -- | None Available |
Source: Public Records
Tax History
| Year | Tax Paid | Tax Assessment Tax Assessment Total Assessment is a certain percentage of the fair market value that is determined by local assessors to be the total taxable value of land and additions on the property. | Land | Improvement |
|---|---|---|---|---|
| 2025 | $12,862 | $2,094,800 | $2,075,000 | $19,800 |
| 2024 | $12,862 | $2,094,800 | $2,075,000 | $19,800 |
| 2023 | $12,757 | $2,094,800 | $2,075,000 | $19,800 |
| 2022 | $11,898 | $2,094,800 | $2,075,000 | $19,800 |
| 2021 | $11,454 | $2,094,800 | $2,075,000 | $19,800 |
| 2020 | $11,019 | $2,094,800 | $2,075,000 | $19,800 |
| 2019 | $10,683 | $2,094,800 | $2,075,000 | $19,800 |
| 2018 | $10,223 | $2,094,800 | $2,075,000 | $19,800 |
| 2017 | $9,916 | $1,783,500 | $1,750,000 | $33,500 |
| 2016 | $9,809 | $1,783,500 | $1,750,000 | $33,500 |
| 2015 | $9,649 | $1,783,500 | $1,750,000 | $33,500 |
| 2014 | $9,542 | $1,783,500 | $1,750,000 | $33,500 |
Source: Public Records
Map
Nearby Homes
Your Personal Tour Guide
Ask me questions while you tour the home.