45 Bourbon St South Windsor, CT 06074
Estimated Value: $548,685 - $584,000
About This Home
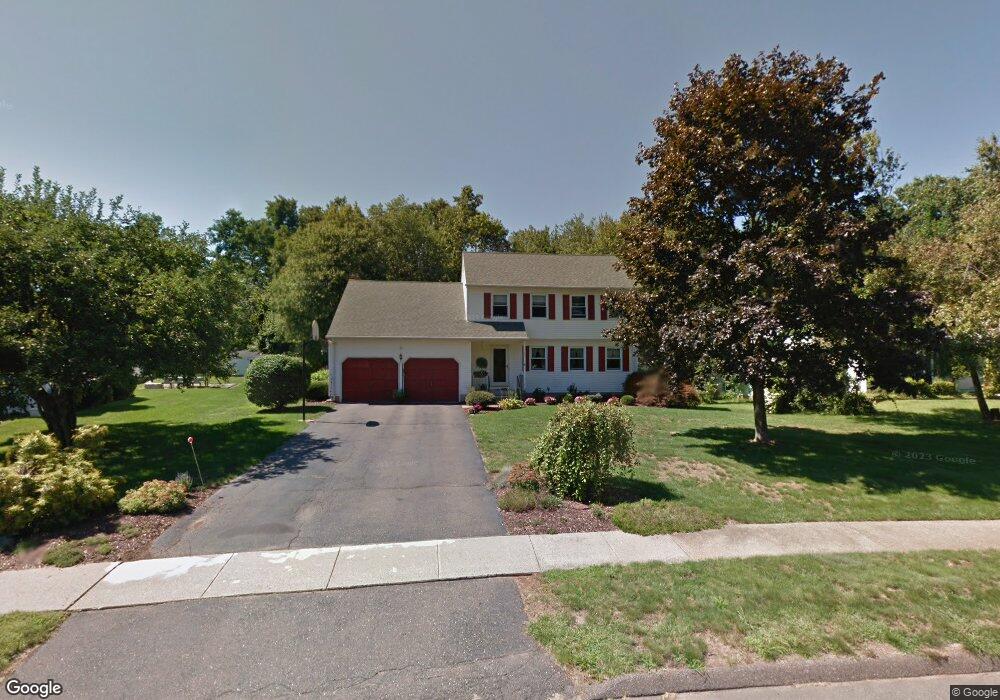
This home is located at 45 Bourbon St, South Windsor, CT 06074 and is currently estimated at $564,171, approximately $259 per square foot. 45 Bourbon St is a home located in Hartford County with nearby schools including Timothy Edwards School and South Windsor High School.
Ownership History
We collect this data history from publicly available records. To have your information removed, we recommend requesting removal directly through your county’s website.
Purchase Details
Home Values in the Area
Average Home Value in this Area
Purchase History
We collect this data history from publicly available records. To have your information removed, we recommend requesting removal directly through your county’s website.
| Date | Buyer | Sale Price | Title Company |
|---|---|---|---|
| $202,000 | -- |
Mortgage History
We collect this data history from publicly available records. To have your information removed, we recommend requesting removal directly through your county’s website.
| Date | Status | Borrower | Loan Amount |
|---|---|---|---|
| Closed | $160,912 | ||
| Closed | $177,860 | ||
| Closed | $100,000 | ||
| Closed | $20,700 |
Tax History
We collect this data history from publicly available records. To have your information removed, we recommend requesting removal directly through your county’s website.
| Year | Tax Paid | Tax Assessment Tax Assessment Total Assessment is a certain percentage of the fair market value that is determined by local assessors to be the total taxable value of land and additions on the property. | Land | Improvement |
|---|---|---|---|---|
| 2025 | $9,889 | $277,700 | $104,100 | $173,600 |
| 2024 | $9,570 | $277,700 | $104,100 | $173,600 |
| 2023 | $9,203 | $277,700 | $104,100 | $173,600 |
| 2022 | $8,452 | $218,000 | $105,100 | $112,900 |
| 2021 | $8,253 | $218,000 | $105,100 | $112,900 |
| 2020 | $8,258 | $218,000 | $105,100 | $112,900 |
| 2019 | $8,393 | $218,000 | $105,100 | $112,900 |
| 2018 | $8,212 | $218,000 | $105,100 | $112,900 |
| 2017 | $8,530 | $224,000 | $105,100 | $118,900 |
| 2016 | $8,364 | $224,000 | $105,100 | $118,900 |
| 2015 | $8,185 | $224,000 | $105,100 | $118,900 |
| 2014 | $7,954 | $224,000 | $105,100 | $118,900 |
Map
- 2270 Ellington Rd
- 2534 Ellington Rd
- 159 Palmer Dr
- 105 Beelzebub Rd
- 73 Norman Dr
- 56 Tumblebrook Dr
- 25 Doria Ln
- 460 Miller Rd
- 435 Abbe Road Extension
- 1004 Summer Hill Dr
- 387 Foster St
- 808 Summer Hill Dr Unit 808
- 371 Felt Rd
- 501 Summer Hill Dr
- 107 Dart Hill Rd
- 25 Chase Farm Rd
- 918 Sand Stone Dr
- 370 Beelzebub Rd
- 6 Vista View Dr Unit 6
- 50 Horizon Cir
- 57 Bourbon St
- 59 Bourbon St
- 51 Bourbon St
- 67 Bourbon St
- 73 Bourbon St
- 37 Bourbon St
- 85 Bourbon St
- 35 Shagbark Rd
- 785 Foster St
- 91 Bourbon St
- 29 Bourbon St
- 797 Foster Street Extension
- 797 Foster St
- 797 Foster St Unit EXT
- 38 Shagbark Rd
- 32 Bourbon St
- 50 Bourbon St
- 60 Bourbon St
- 99 Bourbon St
- 767 Foster St
Ask me questions while you tour the home.