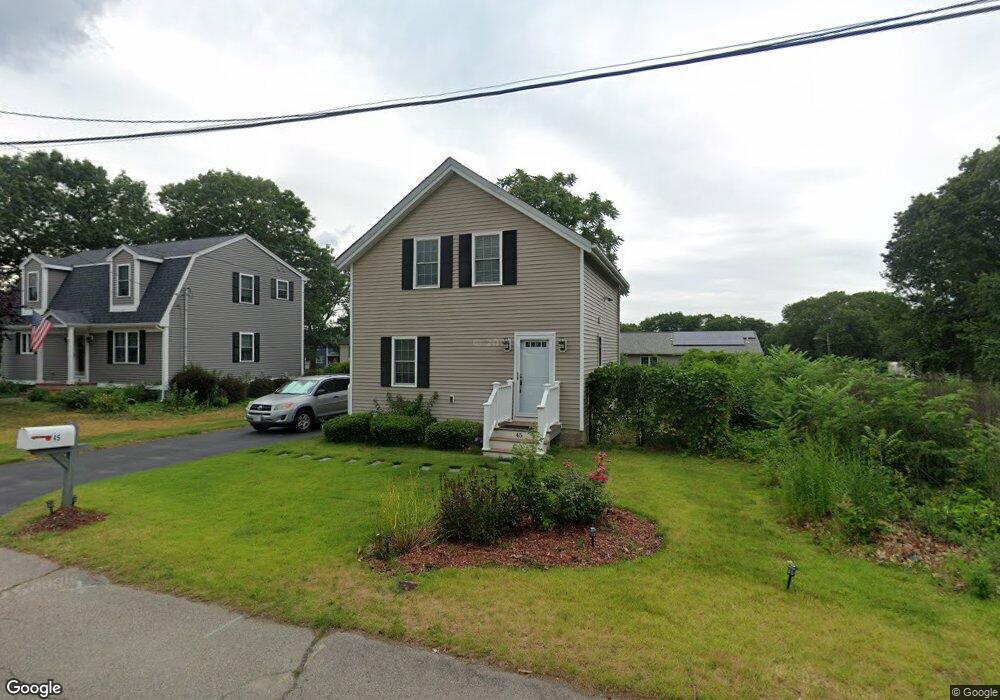
45 E Bacon St Attleboro, MA 02703
Estimated Value: $378,000 - $461,000
2
Beds
2
Baths
898
Sq Ft
$454/Sq Ft
Est. Value
About This Home
This home is located at 45 E Bacon St, Attleboro, MA 02703 and is currently estimated at $407,520, approximately $453 per square foot. 45 E Bacon St is a home located in Bristol County with nearby schools including Hill-Roberts Elementary School, Robert J. Coelho Middle School, and Attleboro High School.
Ownership History
Date
Name
Owned For
Owner Type
Purchase Details
Closed on
Feb 25, 2011
Sold by
Goulet Joshua R
Bought by
Nazzaro Joseph J
Current Estimated Value
Home Financials for this Owner
Home Financials are based on the most recent Mortgage that was taken out on this home.
Original Mortgage
$189,082
Outstanding Balance
$127,289
Interest Rate
4.75%
Mortgage Type
Purchase Money Mortgage
Estimated Equity
$280,231
Purchase Details
Closed on
Dec 8, 2008
Sold by
Murphy Helen M and Murphy-Wrenn Joanne
Bought by
Goulet Joshua R
Home Financials for this Owner
Home Financials are based on the most recent Mortgage that was taken out on this home.
Original Mortgage
$107,400
Interest Rate
6.11%
Mortgage Type
Purchase Money Mortgage
Create a Home Valuation Report for This Property
The Home Valuation Report is an in-depth analysis detailing your home's value as well as a comparison with similar homes in the area
Home Values in the Area
Average Home Value in this Area
Purchase History
We collect this data history from publicly available records. To have your information removed, we recommend requesting removal directly through your county’s website.
| Date | Buyer | Sale Price | Title Company |
|---|---|---|---|
| Nazzaro Joseph J | $194,000 | -- | |
| Goulet Joshua R | $92,000 | -- |
Source: Public Records
Mortgage History
We collect this data history from publicly available records. To have your information removed, we recommend requesting removal directly through your county’s website.
| Date | Status | Borrower | Loan Amount |
|---|---|---|---|
| Open | Nazzaro Joseph J | $189,082 | |
| Previous Owner | Nazzaro Joseph J | $144,000 | |
| Previous Owner | Goulet Joshua R | $107,400 |
Source: Public Records
Tax History
| Year | Tax Paid | Tax Assessment Tax Assessment Total Assessment is a certain percentage of the fair market value that is determined by local assessors to be the total taxable value of land and additions on the property. | Land | Improvement |
|---|---|---|---|---|
| 2025 | $3,829 | $305,100 | $111,200 | $193,900 |
| 2024 | $3,830 | $300,900 | $111,200 | $189,700 |
| 2023 | $3,668 | $267,900 | $101,100 | $166,800 |
| 2022 | $3,540 | $245,000 | $96,300 | $148,700 |
| 2021 | $4,531 | $216,200 | $92,500 | $123,700 |
| 2020 | $2,822 | $215,300 | $89,800 | $125,500 |
| 2019 | $3,294 | $205,800 | $88,100 | $117,700 |
| 2018 | $481 | $185,400 | $85,500 | $99,900 |
| 2017 | $2,718 | $186,800 | $85,500 | $101,300 |
| 2016 | $2,650 | $178,800 | $83,900 | $94,900 |
| 2015 | $2,402 | $163,300 | $83,900 | $79,400 |
| 2014 | $2,330 | $156,900 | $79,900 | $77,000 |
Source: Public Records
Map
Nearby Homes
- 136 Collins St
- 179 Columbine Ave
- 56 Baltic St Unit 56
- 35 Woodbine St
- 215 Kenyon Ave
- 27 Collins Ave
- 362 Kenyon Ave
- 0 Lodi St
- 82 Webster St
- 72 Julian St
- 39 Webster St Unit 101
- 82 Pine Rd
- 310 Mendon Rd
- 208 Sabin St
- 9 Romoli Ave Unit 9
- 25 Mowry St
- 63 W Carpenter St
- 39 Chaplin St
- 548 Kenyon Ave Unit 42
- 46 Slade St
Your Personal Tour Guide
Ask me questions while you tour the home.