45 Green St Fairhaven, MA 02719
Estimated Value: $486,000 - $1,862,819
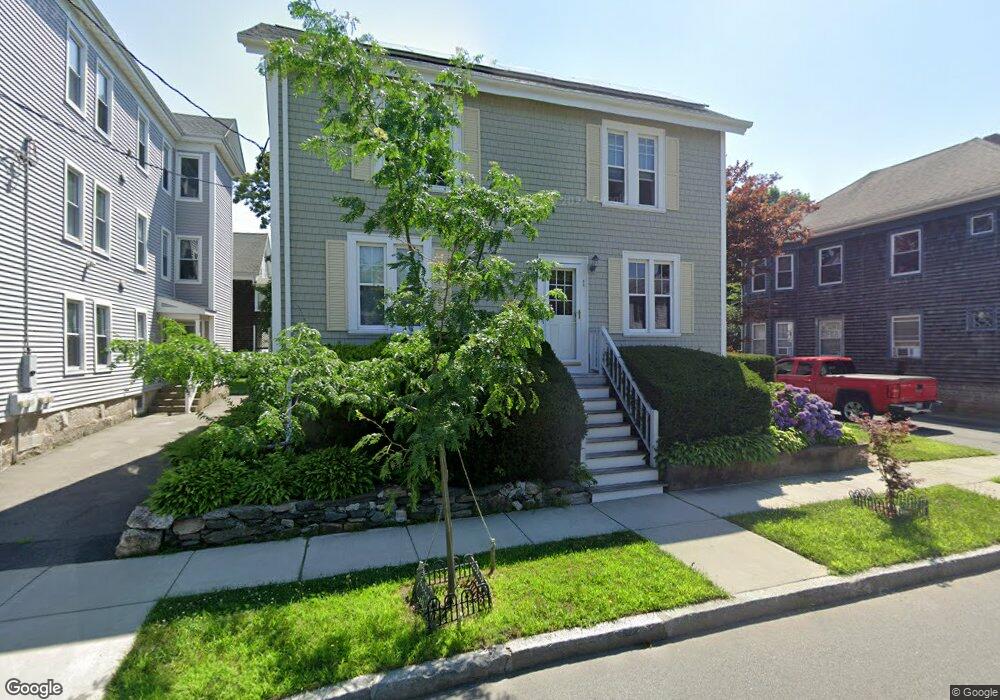
About This Home
This home is located at 45 Green St, Fairhaven, MA 02719 and is currently estimated at $864,455, approximately $345 per square foot. 45 Green St is a home located in Bristol County with nearby schools including Fairhaven High School, City On A Hill Charter Public School New Bedford, and St. Joseph School.
Ownership History
We collect this data history from publicly available records. To have your information removed, we recommend requesting removal directly through your county’s website.
Purchase Details
Purchase Details
Purchase Details
Home Values in the Area
Average Home Value in this Area
Purchase History
We collect this data history from publicly available records. To have your information removed, we recommend requesting removal directly through your county’s website.
| Date | Buyer | Sale Price | Title Company |
|---|---|---|---|
| -- | -- | ||
| -- | -- | ||
| $440,000 | -- |
Mortgage History
We collect this data history from publicly available records. To have your information removed, we recommend requesting removal directly through your county’s website.
| Date | Status | Borrower | Loan Amount |
|---|---|---|---|
| Previous Owner | $180,000 | ||
| Previous Owner | $170,000 | ||
| Previous Owner | $150,000 | ||
| Previous Owner | $110,000 |
Tax History
We collect this data history from publicly available records. To have your information removed, we recommend requesting removal directly through your county’s website.
| Year | Tax Paid | Tax Assessment Tax Assessment Total Assessment is a certain percentage of the fair market value that is determined by local assessors to be the total taxable value of land and additions on the property. | Land | Improvement |
|---|---|---|---|---|
| 2025 | $50 | $535,900 | $242,200 | $293,700 |
| 2024 | $4,868 | $527,400 | $242,200 | $285,200 |
| 2023 | $4,678 | $470,200 | $209,000 | $261,200 |
| 2022 | $4,461 | $436,500 | $190,300 | $246,200 |
| 2021 | $4,355 | $385,700 | $173,000 | $212,700 |
| 2020 | $4,266 | $385,700 | $173,000 | $212,700 |
| 2019 | $4,285 | $367,200 | $148,300 | $218,900 |
| 2018 | $8,735 | $340,000 | $141,100 | $198,900 |
| 2017 | $3,670 | $304,800 | $135,800 | $169,000 |
| 2016 | $3,503 | $287,600 | $133,100 | $154,500 |
| 2015 | $3,443 | $283,400 | $133,100 | $150,300 |
Map
- 48 Farmfield St
- 2 Washburn Ave
- 101 Green St
- 16 Middle St
- 0 Morey Ln
- 58 Washington St
- 8 Washington St
- lot 1 173 Spring St
- 181 Manor Drive Lot 8x
- 59 Bridge St
- 181 Manor Drive Lot B
- 131 Spring St
- 181 Washington St; Lot 8w
- 181 Washington St
- 138 Main St Unit 13
- 58 Bayview Ave
- 27 Bayview Ave
- 9 Brae Rd
- 30 Centre St Unit 2
- 20 Manhattan Ave
Ask me questions while you tour the home.