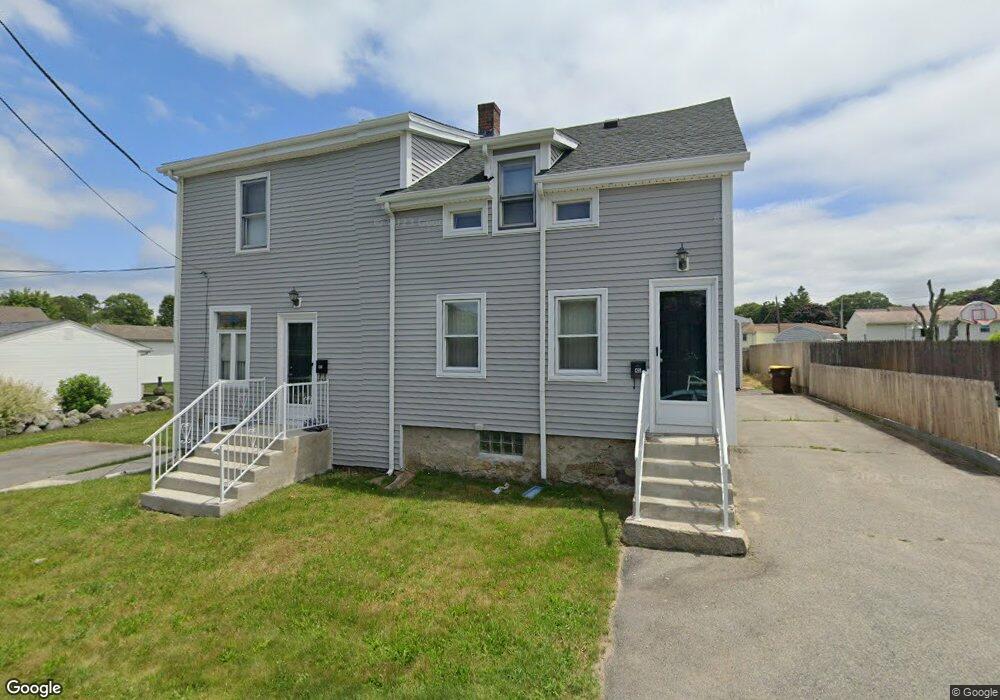
45 Hill St Unit 51 Fall River, MA 02723
Bank Street NeighborhoodEstimated Value: $434,566 - $458,000
4
Beds
2
Baths
1,522
Sq Ft
$294/Sq Ft
Est. Value
About This Home
This home is located at 45 Hill St Unit 51, Fall River, MA 02723 and is currently estimated at $447,392, approximately $293 per square foot. 45 Hill St Unit 51 is a home located in Bristol County with nearby schools including Mary Fonseca Elementary School, Talbot Innovation School, and B M C Durfee High School.
Ownership History
Date
Name
Owned For
Owner Type
Purchase Details
Closed on
Jul 24, 2025
Sold by
A M & Emilia Silva Irt and Scarano
Bought by
Oneil Patricia
Current Estimated Value
Home Financials for this Owner
Home Financials are based on the most recent Mortgage that was taken out on this home.
Original Mortgage
$435,958
Outstanding Balance
$434,093
Interest Rate
6.84%
Mortgage Type
FHA
Estimated Equity
$13,299
Purchase Details
Closed on
Dec 3, 2010
Sold by
Silva Antone M and Silva Emilia
Bought by
Emilia Antone M and Emilia Silva
Create a Home Valuation Report for This Property
The Home Valuation Report is an in-depth analysis detailing your home's value as well as a comparison with similar homes in the area
Home Values in the Area
Average Home Value in this Area
Purchase History
| Date | Buyer | Sale Price | Title Company |
|---|---|---|---|
| Oneil Patricia | $444,000 | -- | |
| Oneil Patricia | $444,000 | -- | |
| Emilia Antone M | -- | -- | |
| Emilia Antone M | -- | -- | |
| Emilia Antone M | -- | -- |
Source: Public Records
Mortgage History
| Date | Status | Borrower | Loan Amount |
|---|---|---|---|
| Open | Oneil Patricia | $435,958 | |
| Closed | Oneil Patricia | $435,958 |
Source: Public Records
Tax History
| Year | Tax Paid | Tax Assessment Tax Assessment Total Assessment is a certain percentage of the fair market value that is determined by local assessors to be the total taxable value of land and additions on the property. | Land | Improvement |
|---|---|---|---|---|
| 2025 | $4,257 | $371,800 | $130,700 | $241,100 |
| 2024 | $3,946 | $343,400 | $125,700 | $217,700 |
| 2023 | $3,537 | $288,300 | $107,800 | $180,500 |
| 2022 | $3,264 | $258,600 | $98,000 | $160,600 |
| 2021 | $3,063 | $221,500 | $90,600 | $130,900 |
| 2020 | $2,798 | $193,600 | $86,700 | $106,900 |
| 2019 | $2,662 | $182,600 | $82,600 | $100,000 |
| 2018 | $2,482 | $169,800 | $81,100 | $88,700 |
| 2017 | $2,339 | $167,100 | $82,700 | $84,400 |
| 2016 | $2,301 | $168,800 | $86,200 | $82,600 |
| 2015 | $2,139 | $163,500 | $83,000 | $80,500 |
| 2014 | $2,190 | $174,100 | $87,300 | $86,800 |
Source: Public Records
Map
Nearby Homes
Your Personal Tour Guide
Ask me questions while you tour the home.