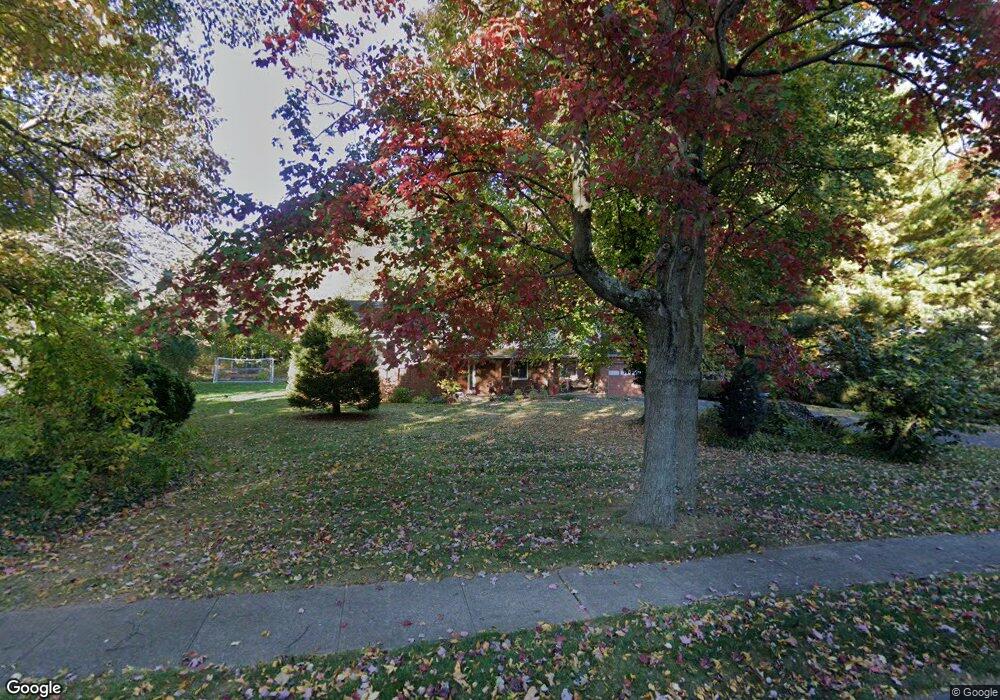
45 Melcon Dr Southington, CT 06489
West Southington NeighborhoodEstimated Value: $446,000 - $504,000
About This Home
This home is located at 45 Melcon Dr, Southington, CT 06489 and is currently estimated at $473,407, approximately $311 per square foot. 45 Melcon Dr is a home located in Hartford County with nearby schools including Reuben E. Thalberg Elementary School, Joseph A. Depaolo Middle School, and Southington High School.
Ownership History
We collect this data history from publicly available records. To have your information removed, we recommend requesting removal directly through your county’s website.
Purchase Details
Home Values in the Area
Average Home Value in this Area
Purchase History
We collect this data history from publicly available records. To have your information removed, we recommend requesting removal directly through your county’s website.
| Date | Buyer | Sale Price | Title Company |
|---|---|---|---|
| -- | -- |
Mortgage History
We collect this data history from publicly available records. To have your information removed, we recommend requesting removal directly through your county’s website.
| Date | Status | Borrower | Loan Amount |
|---|---|---|---|
| Open | $200,000 | ||
| Previous Owner | $137,000 |
Tax History
We collect this data history from publicly available records. To have your information removed, we recommend requesting removal directly through your county’s website.
| Year | Tax Paid | Tax Assessment Tax Assessment Total Assessment is a certain percentage of the fair market value that is determined by local assessors to be the total taxable value of land and additions on the property. | Land | Improvement |
|---|---|---|---|---|
| 2025 | $7,816 | $235,350 | $71,400 | $163,950 |
| 2024 | $7,399 | $235,350 | $71,400 | $163,950 |
| 2023 | $7,099 | $233,820 | $71,400 | $162,420 |
| 2022 | $6,811 | $233,820 | $71,400 | $162,420 |
| 2021 | $6,788 | $233,820 | $71,400 | $162,420 |
| 2020 | $6,669 | $217,730 | $72,860 | $144,870 |
| 2019 | $6,671 | $217,730 | $72,860 | $144,870 |
| 2018 | $6,636 | $217,730 | $72,860 | $144,870 |
| 2017 | $6,636 | $217,730 | $72,860 | $144,870 |
| 2016 | $6,454 | $217,730 | $72,860 | $144,870 |
| 2015 | $6,198 | $212,700 | $69,390 | $143,310 |
| 2014 | $6,032 | $212,700 | $69,390 | $143,310 |
Map
- 558 Lazy Ln
- 46 Garden Gate Rd
- 207 Lazy Ln Unit 9
- 207 Lazy Ln Unit 7
- 207 Lazy Ln Unit 10
- 207 Lazy Ln Unit 2
- 207 Lazy Ln Unit 1
- 207 Lazy Ln Unit 6
- 207 Lazy Ln Unit 12
- 207 Lazy Ln Unit 11
- 207 Lazy Ln Unit 8
- 207 Lazy Ln Unit 4
- 207 Lazy Ln Unit 22
- 554 Spring St
- 600 Main St Unit 7
- 495 Spring St
- 228 Hilltop Dr
- 1384 West St
- 73 Cortland Way
- 273 Queen St Unit 14E
Ask me questions while you tour the home.