45 Nipmuc Rd Framingham, MA 01702
Estimated Value: $498,000 - $572,413
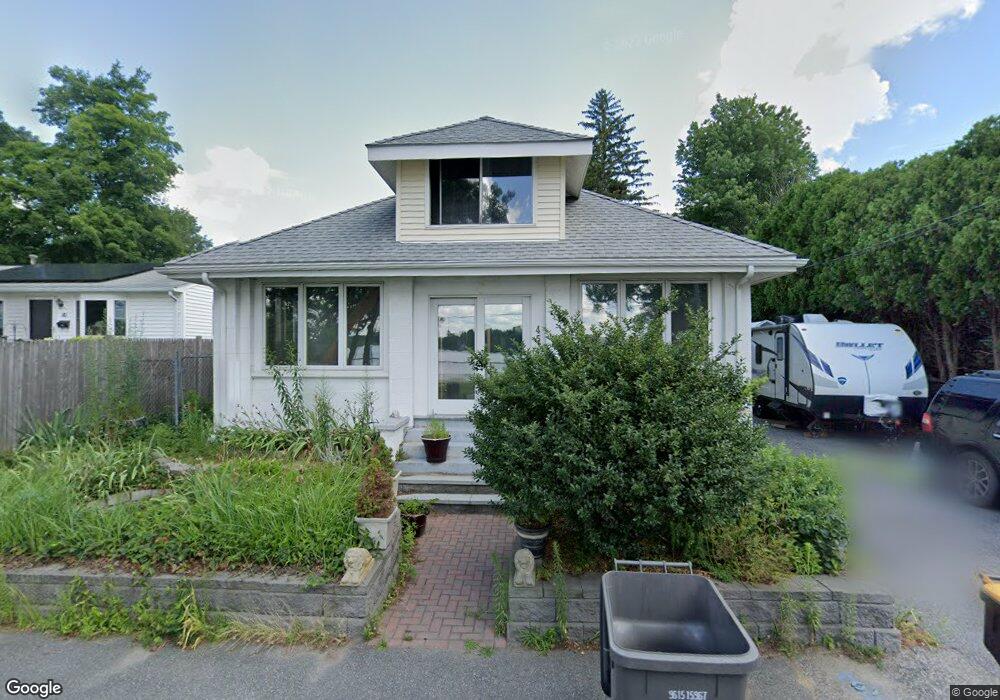
About This Home
This home is located at 45 Nipmuc Rd, Framingham, MA 01702 and is currently estimated at $549,353, approximately $394 per square foot. 45 Nipmuc Rd is a home located in Middlesex County with nearby schools including Framingham High School, Pincushion Hill Montessori School, and Happy Hollow School.
Ownership History
We collect this data history from publicly available records. To have your information removed, we recommend requesting removal directly through your county’s website.
Purchase Details
Purchase Details
Home Values in the Area
Average Home Value in this Area
Purchase History
We collect this data history from publicly available records. To have your information removed, we recommend requesting removal directly through your county’s website.
| Date | Buyer | Sale Price | Title Company |
|---|---|---|---|
| -- | None Available | ||
| -- | None Available | ||
| -- | -- |
Mortgage History
We collect this data history from publicly available records. To have your information removed, we recommend requesting removal directly through your county’s website.
| Date | Status | Borrower | Loan Amount |
|---|---|---|---|
| Previous Owner | $90,000 | ||
| Previous Owner | $90,000 | ||
| Previous Owner | $85,500 |
Tax History
We collect this data history from publicly available records. To have your information removed, we recommend requesting removal directly through your county’s website.
| Year | Tax Paid | Tax Assessment Tax Assessment Total Assessment is a certain percentage of the fair market value that is determined by local assessors to be the total taxable value of land and additions on the property. | Land | Improvement |
|---|---|---|---|---|
| 2025 | $6,064 | $507,900 | $200,900 | $307,000 |
| 2024 | $5,810 | $466,300 | $178,700 | $287,600 |
| 2023 | $5,353 | $408,900 | $159,600 | $249,300 |
| 2022 | $5,063 | $368,500 | $144,800 | $223,700 |
| 2021 | $4,934 | $351,200 | $139,100 | $212,100 |
| 2020 | $4,916 | $328,200 | $121,300 | $206,900 |
| 2019 | $4,725 | $307,200 | $115,600 | $191,600 |
| 2018 | $4,588 | $281,100 | $107,600 | $173,500 |
| 2017 | $4,485 | $268,400 | $103,500 | $164,900 |
| 2016 | $4,102 | $236,000 | $97,900 | $138,100 |
| 2015 | $4,091 | $229,600 | $97,600 | $132,000 |
Map
- 69 Gilbert St
- 42 Winthrop St
- 135 Winthrop St Unit 4A
- 137 Winthrop St Unit 12A
- 15 Cove Ave
- 95 Cedar St
- 15 Foss Rd Unit A
- 62 Cedar St
- 120 Arlington St
- 19 Bethany Rd Unit 19
- 7 Daisley Place
- 31 Waushakum Ave
- 92 Alexander St
- 27 Gordon St Unit 305
- 27 Gordon St Unit 206
- 22 Douglas Rd
- 45 Daytona Ave
- 19 Hawthorne Rd
- 23 Benson Ave
- 103 Wilson Ave
Ask me questions while you tour the home.