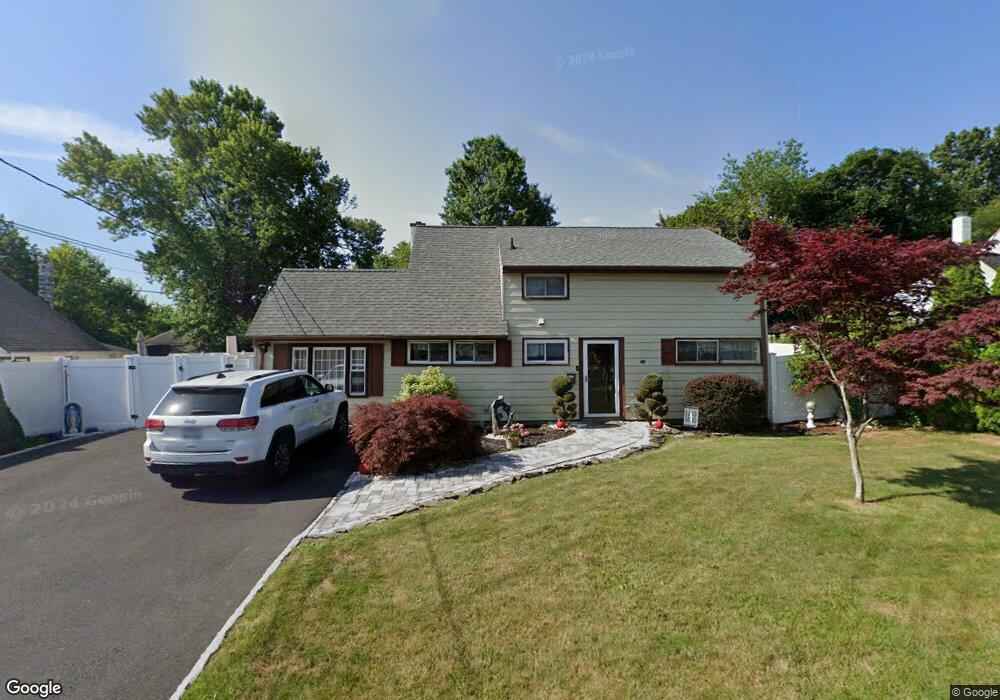
45 Pine Tree Rd Old Bridge, NJ 08857
Estimated Value: $400,615 - $577,000
Studio
--
Bath
1,352
Sq Ft
$377/Sq Ft
Est. Value
About This Home
This home is located at 45 Pine Tree Rd, Old Bridge, NJ 08857 and is currently estimated at $509,404, approximately $376 per square foot. 45 Pine Tree Rd is a home located in Middlesex County with nearby schools including Old Bridge High School, Hatikvah International Charter School, and Calvary Christian School.
Ownership History
Date
Name
Owned For
Owner Type
Purchase Details
Closed on
Jul 26, 2023
Sold by
Martins Maryann and Martins Michael
Bought by
Martins Maryann and Martins Michael
Current Estimated Value
Purchase Details
Closed on
Mar 29, 2021
Sold by
Guarino Charlotte and Martins Maryann
Bought by
Martins Maryann and Martins Michael
Purchase Details
Closed on
Mar 20, 2018
Sold by
Guarino Charlotte and Guarino Marco
Bought by
Guarino Charlotte and Martins Maryann
Purchase Details
Closed on
Jan 20, 1979
Bought by
Guarino Marco and Guarino Charlotte
Create a Home Valuation Report for This Property
The Home Valuation Report is an in-depth analysis detailing your home's value as well as a comparison with similar homes in the area
Home Values in the Area
Average Home Value in this Area
Purchase History
| Date | Buyer | Sale Price | Title Company |
|---|---|---|---|
| Martins Maryann | -- | None Listed On Document | |
| Martins Maryann | -- | None Available | |
| Guarino Charlotte | -- | None Listed On Document | |
| Guarino Charlotte | -- | None Available | |
| Guarino Marco | $48,000 | -- |
Source: Public Records
Tax History
| Year | Tax Paid | Tax Assessment Tax Assessment Total Assessment is a certain percentage of the fair market value that is determined by local assessors to be the total taxable value of land and additions on the property. | Land | Improvement |
|---|---|---|---|---|
| 2025 | $6,359 | $112,600 | $50,800 | $61,800 |
| 2024 | $6,100 | $112,600 | $50,800 | $61,800 |
| 2023 | $6,100 | $112,600 | $50,800 | $61,800 |
| 2022 | $5,960 | $112,600 | $50,800 | $61,800 |
| 2021 | $4,374 | $112,600 | $50,800 | $61,800 |
| 2020 | $5,784 | $112,600 | $50,800 | $61,800 |
| 2019 | $5,686 | $112,600 | $50,800 | $61,800 |
| 2018 | $5,623 | $112,600 | $50,800 | $61,800 |
| 2017 | $5,441 | $112,600 | $50,800 | $61,800 |
| 2016 | $5,328 | $112,600 | $50,800 | $61,800 |
| 2015 | $5,236 | $112,600 | $50,800 | $61,800 |
| 2014 | $5,183 | $112,600 | $50,800 | $61,800 |
Source: Public Records
Map
Nearby Homes
- 23 Orchard Dr
- 24 Kensington Ave
- 110 Charles St
- 82 Madison Ave
- 98 Madison Ave
- 931 Englishtown Rd
- 132 Southwood Dr
- 14 Andover Rd
- 21 Pine St
- 1212 Englishtown Rd
- 268 Austin Ave
- 1210 Englishtown Rd
- 30 Arvin Rd
- 296 Herbert Ave
- 52 Sunset Ave
- 315 Herbert Ave
- 34 Brookside Ave
- 170 Main St
- 41 Brookside Ave
- 41 Brookside Dr Ave
Your Personal Tour Guide
Ask me questions while you tour the home.