45 Rose St Milton, MA 02186
Estimated Value: $1,314,182 - $1,458,000
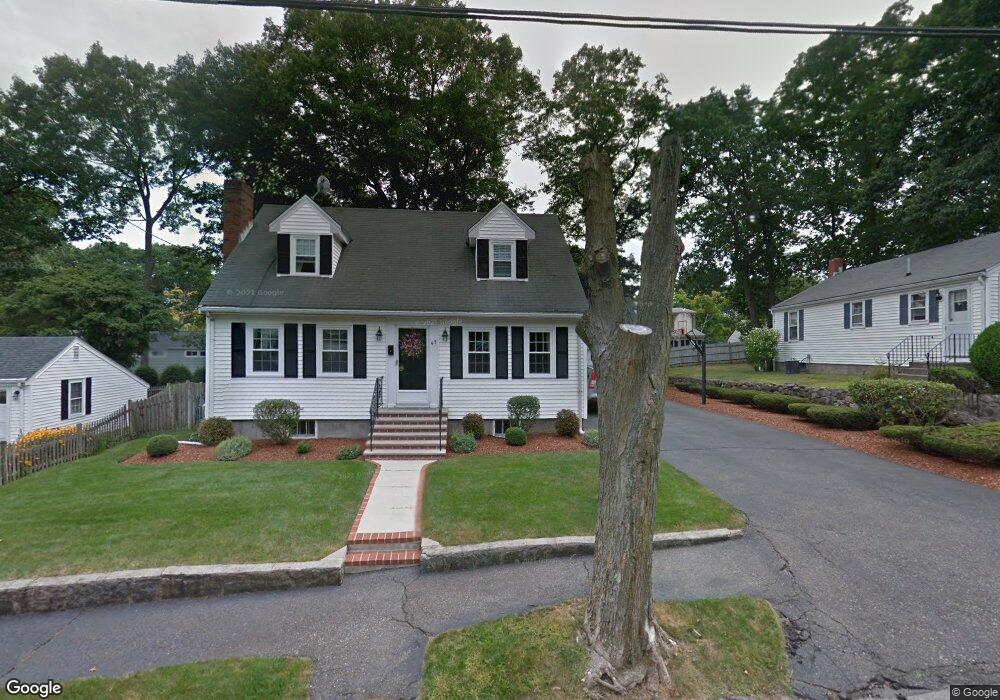
About This Home
This home is located at 45 Rose St, Milton, MA 02186 and is currently estimated at $1,385,046, approximately $517 per square foot. 45 Rose St is a home located in Norfolk County with nearby schools including Milton High School, St. Agatha School, and Milton Academy.
Ownership History
We collect this data history from publicly available records. To have your information removed, we recommend requesting removal directly through your county’s website.
Purchase Details
Purchase Details
Purchase Details
Purchase History
We collect this data history from publicly available records. To have your information removed, we recommend requesting removal directly through your county’s website.
| Date | Buyer | Sale Price | Title Company |
|---|---|---|---|
| -- | None Available | ||
| -- | -- | ||
| -- | -- |
Mortgage History
We collect this data history from publicly available records. To have your information removed, we recommend requesting removal directly through your county’s website.
| Date | Status | Borrower | Loan Amount |
|---|---|---|---|
| Previous Owner | $175,000 | ||
| Previous Owner | $15,000 | ||
| Previous Owner | $136,500 | ||
| Previous Owner | $140,000 |
Tax History
We collect this data history from publicly available records. To have your information removed, we recommend requesting removal directly through your county’s website.
| Year | Tax Paid | Tax Assessment Tax Assessment Total Assessment is a certain percentage of the fair market value that is determined by local assessors to be the total taxable value of land and additions on the property. | Land | Improvement |
|---|---|---|---|---|
| 2025 | $11,598 | $1,045,800 | $511,800 | $534,000 |
| 2024 | $11,273 | $1,032,300 | $487,400 | $544,900 |
| 2023 | $11,272 | $988,800 | $464,300 | $524,500 |
| 2022 | $10,878 | $872,300 | $464,300 | $408,000 |
| 2021 | $9,981 | $760,200 | $371,700 | $388,500 |
| 2020 | $9,923 | $756,300 | $356,100 | $400,200 |
| 2019 | $9,608 | $729,000 | $345,700 | $383,300 |
| 2018 | $7,652 | $554,100 | $301,900 | $252,200 |
| 2017 | $7,157 | $527,800 | $287,500 | $240,300 |
| 2016 | $6,687 | $495,300 | $260,100 | $235,200 |
| 2015 | $6,538 | $469,000 | $239,600 | $229,400 |
Map
- 7 Phyllis Ln
- 98 Pleasant St
- 73 Pleasant St Unit 73
- 403405 Reedsdale Rd
- 282 Highland St
- 268 Highland St
- 29 Buckingham Rd
- 341 Highland St
- 76 Shawmut St
- 52 Ridgewood Rd
- 141 Gardiner Rd
- 650 Canton Ave
- 25 Waldeck Rd
- 263 Adams St
- 37 Sassamon Ave
- 94 Grafton Ave
- 567 Canton Ave
- 213 School St
- 625 Canton Ave
- 85 Old Farm Rd
Ask me questions while you tour the home.