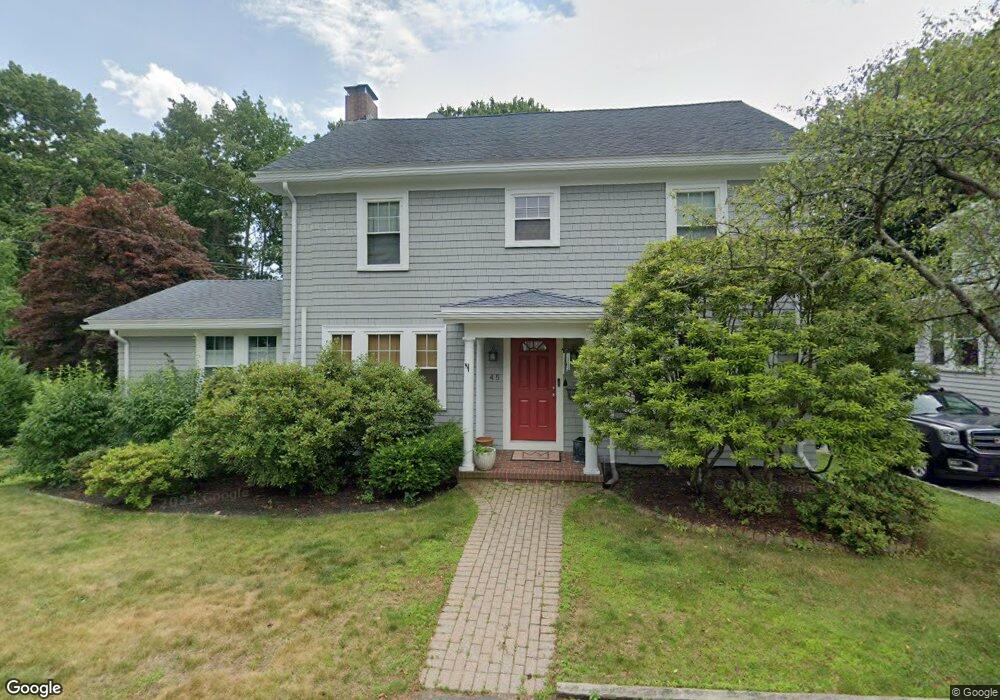
45 Seaview Ave Marblehead, MA 01945
Estimated Value: $1,105,940 - $1,308,000
5
Beds
4
Baths
2,716
Sq Ft
$452/Sq Ft
Est. Value
About This Home
This home is located at 45 Seaview Ave, Marblehead, MA 01945 and is currently estimated at $1,226,735, approximately $451 per square foot. 45 Seaview Ave is a home located in Essex County with nearby schools including Marblehead High School, Devereux School, and Tower School.
Ownership History
Date
Name
Owned For
Owner Type
Purchase Details
Closed on
Jul 29, 2020
Sold by
Mahan Katherine and Mahan Matthew M
Bought by
Mahan Katherine
Current Estimated Value
Home Financials for this Owner
Home Financials are based on the most recent Mortgage that was taken out on this home.
Original Mortgage
$410,000
Interest Rate
2.9%
Mortgage Type
New Conventional
Purchase Details
Closed on
Mar 14, 2012
Sold by
Mahan Matthew
Bought by
Mahan Matthew and Mahan Katherine C
Purchase Details
Closed on
Feb 28, 2008
Sold by
Peterson John and Peterson Patricia M
Bought by
Mahan Matthew
Purchase Details
Closed on
Feb 2, 1987
Sold by
Waters Henry
Bought by
Forty Five Seaview Rt
Create a Home Valuation Report for This Property
The Home Valuation Report is an in-depth analysis detailing your home's value as well as a comparison with similar homes in the area
Home Values in the Area
Average Home Value in this Area
Purchase History
We collect this data history from publicly available records. To have your information removed, we recommend requesting removal directly through your county’s website.
| Date | Buyer | Sale Price | Title Company |
|---|---|---|---|
| Mahan Katherine | -- | None Available | |
| Mahan Katherine C | -- | None Available | |
| Mahan Matthew | -- | -- | |
| Mahan Matthew M | -- | -- | |
| Mahan Matthew | $555,000 | -- | |
| Mahan Matthew M | $555,000 | -- | |
| Forty Five Seaview Rt | $233,000 | -- |
Source: Public Records
Mortgage History
We collect this data history from publicly available records. To have your information removed, we recommend requesting removal directly through your county’s website.
| Date | Status | Borrower | Loan Amount |
|---|---|---|---|
| Previous Owner | Mahan Katherine C | $410,000 | |
| Previous Owner | Forty Five Seaview Rt | $395,350 |
Source: Public Records
Tax History
| Year | Tax Paid | Tax Assessment Tax Assessment Total Assessment is a certain percentage of the fair market value that is determined by local assessors to be the total taxable value of land and additions on the property. | Land | Improvement |
|---|---|---|---|---|
| 2025 | $9,189 | $1,015,400 | $606,000 | $409,400 |
| 2024 | $10,446 | $1,165,900 | $770,100 | $395,800 |
| 2023 | $8,792 | $879,200 | $561,800 | $317,400 |
| 2022 | $8,181 | $777,700 | $467,100 | $310,600 |
| 2021 | $7,793 | $747,900 | $441,900 | $306,000 |
| 2020 | $7,720 | $743,000 | $454,500 | $288,500 |
| 2019 | $7,451 | $693,800 | $416,600 | $277,200 |
| 2018 | $7,507 | $681,200 | $404,000 | $277,200 |
| 2017 | $7,083 | $643,300 | $366,100 | $277,200 |
| 2016 | $6,580 | $592,800 | $315,600 | $277,200 |
| 2015 | $6,289 | $567,600 | $290,400 | $277,200 |
| 2014 | $5,838 | $526,400 | $265,100 | $261,300 |
Source: Public Records
Map
Nearby Homes
- 212 Humphrey St Unit 202
- 411 Atlantic Ave Unit 2
- 18 Rose Ave
- 21 Phillips Ave
- 30 Shetland Rd
- 21 Leggs Hill Rd
- 26 Pickwick Rd
- 18 Pickwick Rd
- 2 Rolleston Rd
- 20 Ocean Ave
- 128 Ocean Ave
- 2 Ocean Ave
- 11 Angenica Terrace
- 26 Cedar St Unit 2
- 9 Cedar St
- 1008 Paradise Rd Unit 2E
- 1008 Paradise Rd Unit 3N
- 1002 Paradise Rd Unit PHE
- 15 Oak View Ave
- 1004 Paradise Rd Unit PHB
Your Personal Tour Guide
Ask me questions while you tour the home.