
Seller's Agent in 2025
Jennifer Lamoureux
Moor Realty Group
(508) 558-2689
1 in this area
134 Total Sales
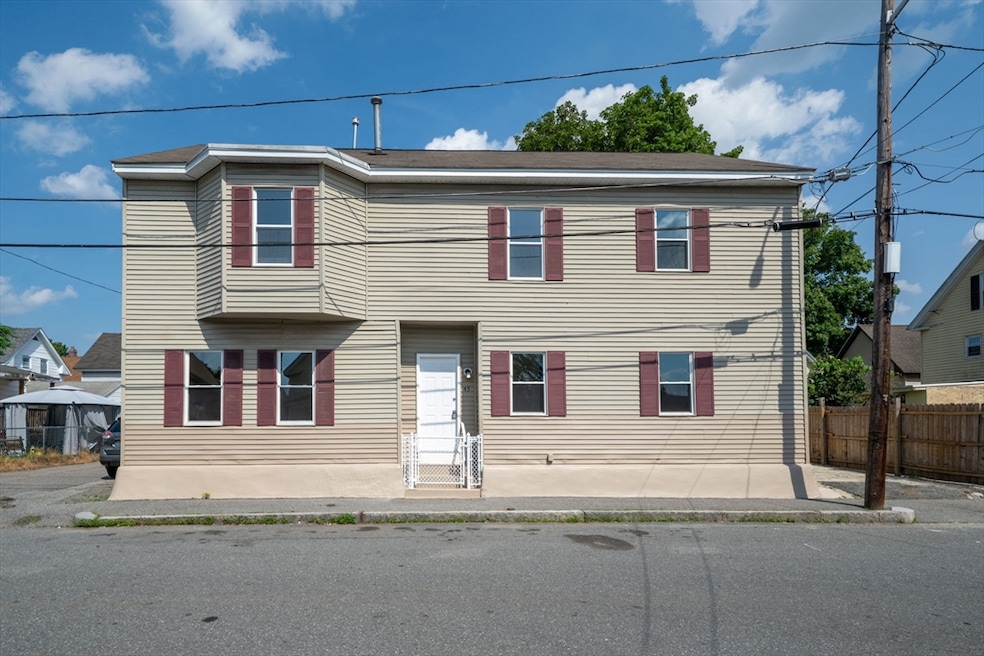
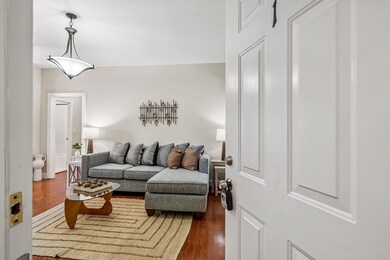
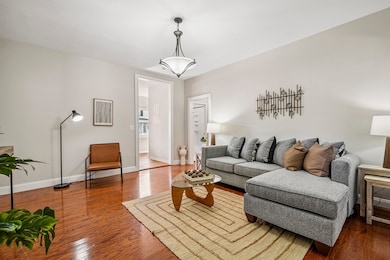
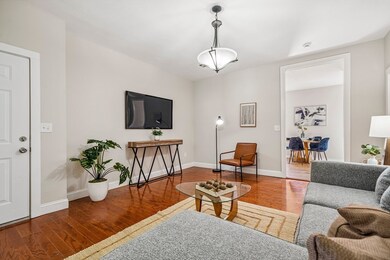
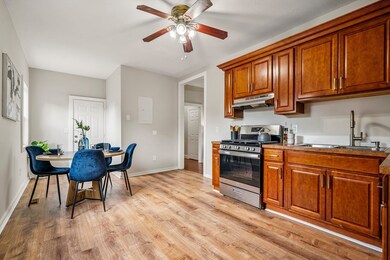
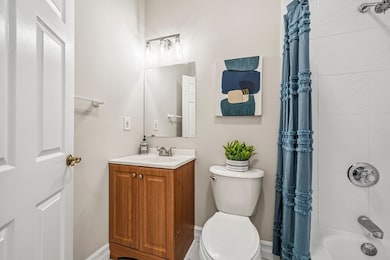
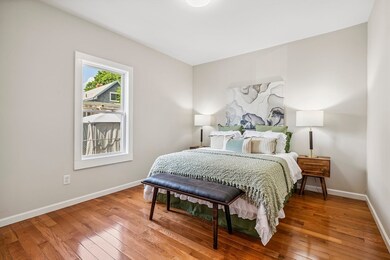
The perfect turnkey investment property for Landlords or owner occupancy! This two-family home offers appealing three-bed and four-bed floor plans for potential renters, both with refreshed paint and flooring. The first floor enjoys basement access for storage, and the second floor has attic storage. The first floor unit offers three bedrooms and a full bath, with an eat-in kitchen and large living room. The second floor boasts four bedrooms, one full bath, new kitchen cabinets, new gas stove and a spacious living area. Bus stops and a commuter rail station nearby make it a commuter-friendly location.
| Date | Type | Sale Price | Title Company |
|---|---|---|---|
| Quit Claim Deed | $725,000 | -- | |
| Deed | $725,000 | -- | |
| Quit Claim Deed | $350,000 | None Available | |
| Quit Claim Deed | $350,000 | None Available | |
| Quit Claim Deed | $350,000 | None Available | |
| Quit Claim Deed | -- | None Available | |
| Quit Claim Deed | -- | None Available | |
| Quit Claim Deed | -- | None Available | |
| Quit Claim Deed | -- | -- | |
| Quit Claim Deed | -- | -- | |
| Quit Claim Deed | -- | -- | |
| Deed | $290,000 | -- | |
| Deed | $290,000 | -- | |
| Deed | $290,000 | -- | |
| Deed | $160,000 | -- | |
| Deed | $160,000 | -- | |
| Deed | $87,500 | -- | |
| Deed | $87,500 | -- | |
| Deed | $1,000 | -- | |
| Deed | $1,000 | -- | |
| Deed | $12,500 | -- | |
| Deed | $12,500 | -- | |
| Deed | $1,000 | -- | |
| Deed | $1,000 | -- | |
| Foreclosure Deed | $33,131 | -- | |
| Foreclosure Deed | $33,131 | -- | |
| Deed | $45,500 | -- | |
| Deed | $45,500 | -- | |
| Deed | $75,000 | -- | |
| Deed | $75,000 | -- |
| Date | Status | Loan Amount | Loan Type |
|---|---|---|---|
| Open | $543,750 | New Conventional | |
| Closed | $543,750 | New Conventional | |
| Previous Owner | $330,750 | Construction | |
| Previous Owner | $185,000 | New Conventional | |
| Previous Owner | $239,600 | New Conventional |
| Date | Event | Price | List to Sale | Price per Sq Ft |
|---|---|---|---|---|
| 07/31/2025 07/31/25 | Sold | $725,000 | +3.7% | $287 / Sq Ft |
| 06/30/2025 06/30/25 | Pending | -- | -- | -- |
| 06/26/2025 06/26/25 | Price Changed | $699,000 | -0.1% | $276 / Sq Ft |
| 06/25/2025 06/25/25 | For Sale | $700,000 | -- | $277 / Sq Ft |
| Year | Tax Paid | Tax Assessment Tax Assessment Total Assessment is a certain percentage of the fair market value that is determined by local assessors to be the total taxable value of land and additions on the property. | Land | Improvement |
|---|---|---|---|---|
| 2025 | $6,376 | $555,400 | $91,600 | $463,800 |
| 2024 | $5,839 | $490,300 | $80,500 | $409,800 |
| 2023 | $5,444 | $438,300 | $70,000 | $368,300 |
| 2022 | $4,981 | $392,500 | $59,600 | $332,900 |
| 2021 | $4,619 | $343,200 | $51,800 | $291,400 |
| 2020 | $4,391 | $328,700 | $60,200 | $268,500 |
| 2019 | $4,018 | $286,200 | $53,200 | $233,000 |
| 2018 | $3,728 | $259,100 | $50,600 | $208,500 |
| 2017 | $3,524 | $236,200 | $46,000 | $190,200 |
| 2016 | $3,481 | $229,600 | $37,400 | $192,200 |
| 2015 | $3,150 | $203,500 | $35,800 | $167,700 |
| 2013 | $2,790 | $185,900 | $43,800 | $142,100 |
Seller's Agent in 2025
Jennifer Lamoureux
Moor Realty Group
(508) 558-2689
1 in this area
134 Total Sales
Buyer's Agent in 2025
Tim Desmarais
Keller Williams Realty
(603) 765-1965
3 in this area
151 Total Sales
Source: MLS Property Information Network (MLS PIN)
MLS Number: 73396820
APN: LOWE-000175-005490-000045
Disclaimer: Certain information contained herein is derived from information provided by parties other than Homes.com. All information provided is deemed reliable, but is not guaranteed to be accurate and should be independently verified.
![]() The property listing data and information, or the Images, set forth herein were provided to MLS Property Information Network, Inc. from third party sources, including sellers, lessors and public records, and were compiled by MLS Property Information Network, Inc. The property listing data and information, and the Images, are for the personal, non-commercial use of consumers having a good faith interest in purchasing or leasing listed properties of the type displayed to them and may not be used for any purpose other than to identify prospective properties which such consumers may have a good faith interest in purchasing or leasing. MLS Property Information Network, Inc. and its subscribers disclaim any and all representations and warranties as to the accuracy of the property listing data and information, or as to the accuracy of any of the Images, set forth herein.
The property listing data and information, or the Images, set forth herein were provided to MLS Property Information Network, Inc. from third party sources, including sellers, lessors and public records, and were compiled by MLS Property Information Network, Inc. The property listing data and information, and the Images, are for the personal, non-commercial use of consumers having a good faith interest in purchasing or leasing listed properties of the type displayed to them and may not be used for any purpose other than to identify prospective properties which such consumers may have a good faith interest in purchasing or leasing. MLS Property Information Network, Inc. and its subscribers disclaim any and all representations and warranties as to the accuracy of the property listing data and information, or as to the accuracy of any of the Images, set forth herein.
Ask me questions while you tour the home.