Estimated Value: $276,606 - $393,000
2
Beds
1
Bath
1,110
Sq Ft
$297/Sq Ft
Est. Value
About This Home
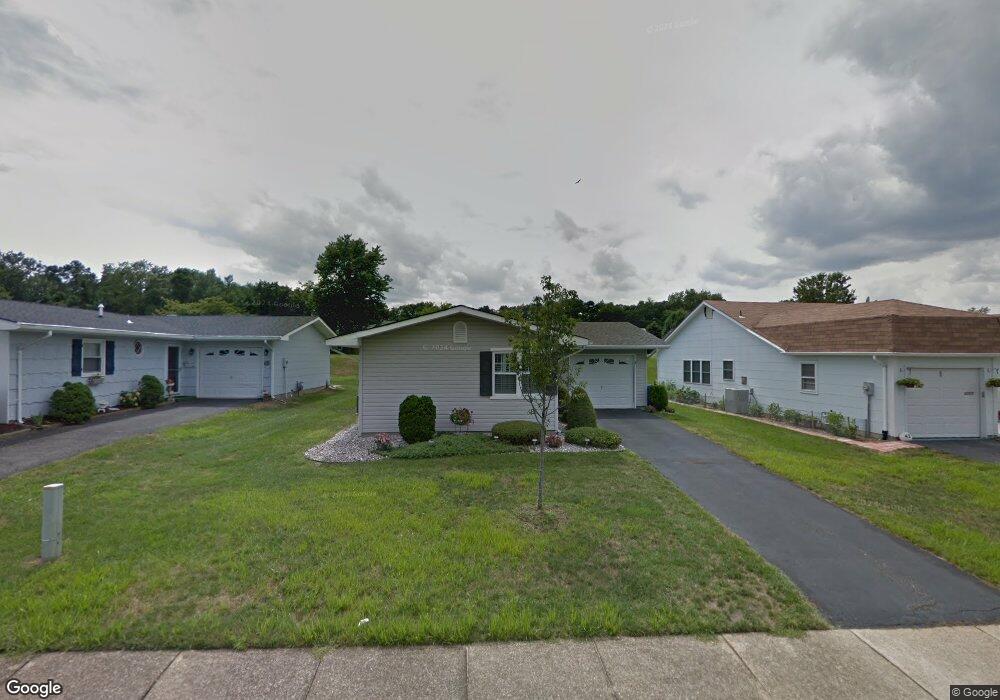
This home is located at 45 Whitman St, Brick, NJ 08724 and is currently estimated at $329,902, approximately $297 per square foot. 45 Whitman St is a home located in Ocean County with nearby schools including Lanes Mill Elementary School, Veterans Memorial Middle School, and Brick Township Memorial High School.
Ownership History
Date
Name
Owned For
Owner Type
Purchase Details
Closed on
Apr 16, 2014
Sold by
Lorentzen Evelyn L
Bought by
Lorentzen Kim
Current Estimated Value
Home Financials for this Owner
Home Financials are based on the most recent Mortgage that was taken out on this home.
Original Mortgage
$132,554
Outstanding Balance
$101,370
Interest Rate
4.5%
Mortgage Type
FHA
Estimated Equity
$228,532
Purchase Details
Closed on
Jul 22, 1998
Sold by
Smith Mathilda and Smith William G
Bought by
Lorentzen Francis and Lorentzen Evelyn
Home Financials for this Owner
Home Financials are based on the most recent Mortgage that was taken out on this home.
Original Mortgage
$40,000
Interest Rate
6.92%
Create a Home Valuation Report for This Property
The Home Valuation Report is an in-depth analysis detailing your home's value as well as a comparison with similar homes in the area
Home Values in the Area
Average Home Value in this Area
Purchase History
We collect this data history from publicly available records. To have your information removed, we recommend requesting removal directly through your county’s website.
| Date | Buyer | Sale Price | Title Company |
|---|---|---|---|
| Lorentzen Kim | $135,000 | None Available | |
| Lorentzen Francis | $57,900 | -- |
Source: Public Records
Mortgage History
We collect this data history from publicly available records. To have your information removed, we recommend requesting removal directly through your county’s website.
| Date | Status | Borrower | Loan Amount |
|---|---|---|---|
| Open | Lorentzen Kim | $132,554 | |
| Closed | Lorentzen Francis | $40,000 |
Source: Public Records
Tax History
| Year | Tax Paid | Tax Assessment Tax Assessment Total Assessment is a certain percentage of the fair market value that is determined by local assessors to be the total taxable value of land and additions on the property. | Land | Improvement |
|---|---|---|---|---|
| 2025 | $2,920 | $106,500 | $40,000 | $66,500 |
| 2024 | $2,638 | $106,500 | $40,000 | $66,500 |
| 2023 | $2,600 | $106,500 | $40,000 | $66,500 |
| 2022 | $2,600 | $106,500 | $40,000 | $66,500 |
| 2021 | $2,545 | $106,500 | $40,000 | $66,500 |
| 2020 | $2,512 | $106,500 | $40,000 | $66,500 |
| 2019 | $2,468 | $106,500 | $40,000 | $66,500 |
| 2018 | $2,411 | $106,500 | $40,000 | $66,500 |
| 2017 | $2,346 | $106,500 | $40,000 | $66,500 |
| 2016 | $2,333 | $106,500 | $40,000 | $66,500 |
| 2015 | $2,273 | $96,800 | $40,000 | $56,800 |
| 2014 | $1,548 | $96,800 | $40,000 | $56,800 |
Source: Public Records
Map
Nearby Homes
Your Personal Tour Guide
Ask me questions while you tour the home.