450 Anthony Ave Piscataway, NJ 08854
Estimated Value: $454,000 - $518,000
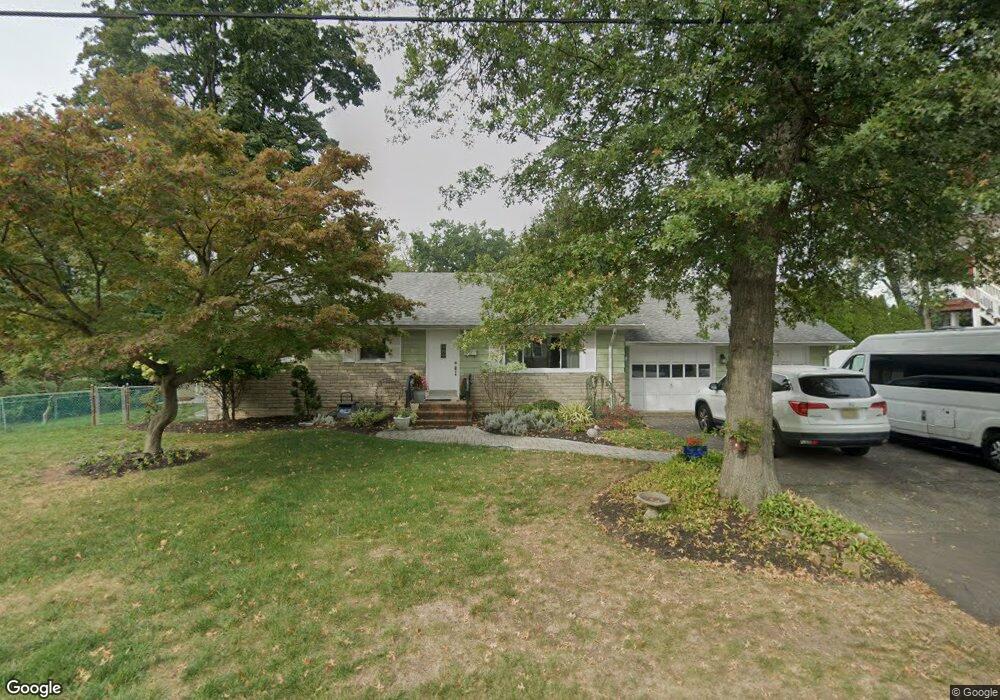
About This Home
This home is located at 450 Anthony Ave, Piscataway, NJ 08854 and is currently estimated at $491,528, approximately $487 per square foot. 450 Anthony Ave is a home located in Middlesex County with nearby schools including Arbor Intermediate School, Dwight D. Eisenhower School, and Quibbletown Middle School.
Ownership History
We collect this data history from publicly available records. To have your information removed, we recommend requesting removal directly through your county’s website.
Purchase Details
Purchase Details
Home Financials for this Owner
Home Financials are based on the most recent Mortgage that was taken out on this home.Home Values in the Area
Average Home Value in this Area
Purchase History
We collect this data history from publicly available records. To have your information removed, we recommend requesting removal directly through your county’s website.
| Date | Buyer | Sale Price | Title Company |
|---|---|---|---|
| $245,000 | Residential Commitment For T | ||
| $275,000 | Multiple |
Mortgage History
We collect this data history from publicly available records. To have your information removed, we recommend requesting removal directly through your county’s website.
| Date | Status | Borrower | Loan Amount |
|---|---|---|---|
| Previous Owner | $247,500 |
Tax History
We collect this data history from publicly available records. To have your information removed, we recommend requesting removal directly through your county’s website.
| Year | Tax Paid | Tax Assessment Tax Assessment Total Assessment is a certain percentage of the fair market value that is determined by local assessors to be the total taxable value of land and additions on the property. | Land | Improvement |
|---|---|---|---|---|
| 2025 | $6,873 | $435,300 | $294,000 | $141,300 |
| 2024 | $7,068 | $356,100 | $189,700 | $166,400 |
| 2023 | $7,068 | $342,100 | $189,700 | $152,400 |
| 2022 | $7,094 | $318,700 | $189,700 | $129,000 |
| 2021 | $6,376 | $275,200 | $159,700 | $115,500 |
| 2020 | $6,249 | $270,300 | $152,200 | $118,100 |
| 2019 | $6,360 | $270,300 | $152,200 | $118,100 |
| 2018 | $6,166 | $263,300 | $152,200 | $111,100 |
| 2017 | $6,401 | $236,100 | $117,200 | $118,900 |
| 2016 | $5,686 | $213,600 | $117,200 | $96,400 |
| 2015 | $5,601 | $213,600 | $117,200 | $96,400 |
| 2014 | $5,477 | $213,600 | $117,200 | $96,400 |
Map
- 1 Hall St
- 34 Harper St
- 2 Church St
- 3 Buchman St
- 20 Sheldon Place
- 323 S Madison Ave
- 729 Walnut St
- 136 Roberts Ave W
- 245 William St
- 425 New Market Rd Unit 2
- 425 New Market Rd
- 57 Desna St
- 27 Sefton Cir
- 45 Montgomery St
- 40 Grove St
- 67 Grant Ave
- 179 Davis Ave
- 61 Vera St
- 675 Bound Brook Rd
- 675 Bound Brook Rd Unit C0001
Ask me questions while you tour the home.