Estimated Value: $594,000 - $719,000
--
Bed
3
Baths
1,637
Sq Ft
$411/Sq Ft
Est. Value
About This Home
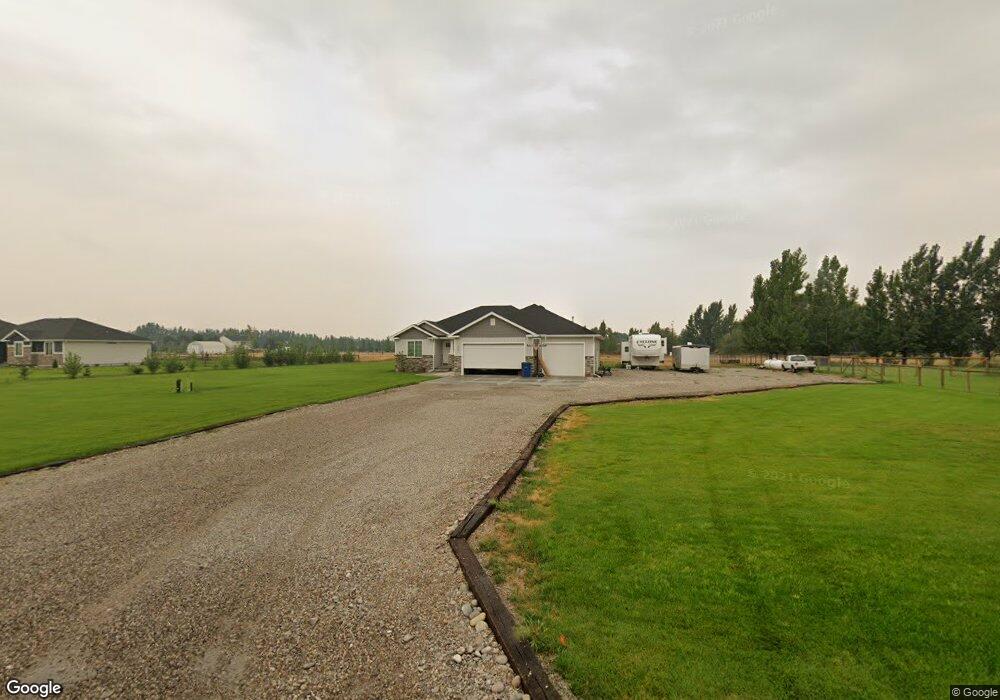
This home is located at 4506 E 266 N, Rigby, ID 83442 and is currently estimated at $673,342, approximately $411 per square foot. 4506 E 266 N is a home with nearby schools including South Fork Elementary School, Rigby Middle School, and Rigby High School.
Ownership History
Date
Name
Owned For
Owner Type
Purchase Details
Closed on
Dec 21, 2017
Sold by
Stoneridge Construction Llc
Bought by
Jones Dallin and Jones Cammie
Current Estimated Value
Home Financials for this Owner
Home Financials are based on the most recent Mortgage that was taken out on this home.
Original Mortgage
$293,270
Outstanding Balance
$246,070
Interest Rate
3.9%
Mortgage Type
New Conventional
Estimated Equity
$427,272
Purchase Details
Closed on
Dec 26, 2012
Sold by
Lessing Chandler and Lessing Erica
Bought by
Zaugg Alonzo and Zaugg Ellen
Create a Home Valuation Report for This Property
The Home Valuation Report is an in-depth analysis detailing your home's value as well as a comparison with similar homes in the area
Home Values in the Area
Average Home Value in this Area
Purchase History
| Date | Buyer | Sale Price | Title Company |
|---|---|---|---|
| Jones Dallin | -- | Alliance Title Rexburg Offic | |
| Zaugg Alonzo | -- | None Available |
Source: Public Records
Mortgage History
| Date | Status | Borrower | Loan Amount |
|---|---|---|---|
| Open | Jones Dallin | $293,270 |
Source: Public Records
Tax History
| Year | Tax Paid | Tax Assessment Tax Assessment Total Assessment is a certain percentage of the fair market value that is determined by local assessors to be the total taxable value of land and additions on the property. | Land | Improvement |
|---|---|---|---|---|
| 2025 | $1,368 | $579,122 | $0 | $0 |
| 2024 | $1,368 | $568,101 | $0 | $0 |
| 2023 | $1,978 | $589,250 | $0 | $0 |
| 2022 | $2,789 | $512,910 | $0 | $0 |
| 2021 | $2,624 | $398,315 | $0 | $0 |
| 2020 | $2,119 | $365,145 | $0 | $0 |
| 2019 | $2,264 | $316,412 | $0 | $0 |
| 2018 | $1,984 | $278,678 | $0 | $0 |
| 2017 | $327 | $30,000 | $0 | $0 |
| 2016 | $331 | $30,000 | $0 | $0 |
| 2015 | $343 | $30,000 | $0 | $0 |
| 2014 | $344 | $30,000 | $0 | $0 |
| 2013 | -- | $30,000 | $0 | $0 |
Source: Public Records
Map
Nearby Homes
Your Personal Tour Guide
Ask me questions while you tour the home.