Estimated Value: $415,605 - $446,000
3
Beds
2
Baths
1,351
Sq Ft
$319/Sq Ft
Est. Value
About This Home
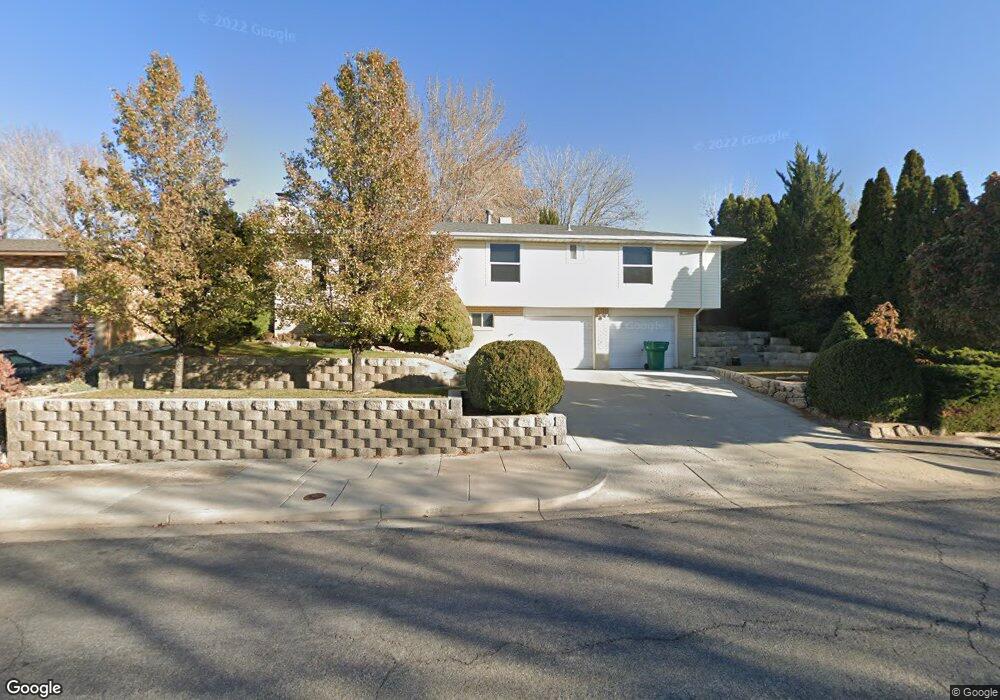
This home is located at 4524 S 2600 W, Roy, UT 84067 and is currently estimated at $431,401, approximately $319 per square foot. 4524 S 2600 W is a home located in Weber County with nearby schools including Valley View School, Sand Ridge Junior High School, and Roy High School.
Ownership History
Date
Name
Owned For
Owner Type
Purchase Details
Closed on
Jul 1, 2024
Sold by
Briggs Kathryn J and Painter Kathryn J
Bought by
Briggs Kathryn J
Current Estimated Value
Home Financials for this Owner
Home Financials are based on the most recent Mortgage that was taken out on this home.
Original Mortgage
$21,475
Outstanding Balance
$21,078
Interest Rate
6.94%
Mortgage Type
New Conventional
Estimated Equity
$410,323
Purchase Details
Closed on
Mar 21, 2002
Sold by
Woodland Kathryn J and Painter Kathryn J
Bought by
Painter Kathryn J
Create a Home Valuation Report for This Property
The Home Valuation Report is an in-depth analysis detailing your home's value as well as a comparison with similar homes in the area
Home Values in the Area
Average Home Value in this Area
Purchase History
We collect this data history from publicly available records. To have your information removed, we recommend requesting removal directly through your county’s website.
| Date | Buyer | Sale Price | Title Company |
|---|---|---|---|
| Briggs Kathryn J | -- | Lincoln Title | |
| Painter Kathryn J | -- | Bonneville Title |
Source: Public Records
Mortgage History
We collect this data history from publicly available records. To have your information removed, we recommend requesting removal directly through your county’s website.
| Date | Status | Borrower | Loan Amount |
|---|---|---|---|
| Open | Briggs Kathryn J | $21,475 |
Source: Public Records
Tax History
| Year | Tax Paid | Tax Assessment Tax Assessment Total Assessment is a certain percentage of the fair market value that is determined by local assessors to be the total taxable value of land and additions on the property. | Land | Improvement |
|---|---|---|---|---|
| 2025 | $2,679 | $424,608 | $112,695 | $311,913 |
| 2024 | $2,612 | $229,349 | $61,982 | $167,367 |
| 2023 | $2,521 | $221,650 | $61,092 | $160,558 |
| 2022 | $2,425 | $218,350 | $55,729 | $162,621 |
| 2021 | $2,035 | $301,000 | $71,154 | $229,846 |
| 2020 | $1,927 | $262,000 | $71,154 | $190,846 |
| 2019 | $1,832 | $234,000 | $40,995 | $193,005 |
| 2018 | $1,808 | $218,000 | $38,926 | $179,074 |
| 2017 | $1,560 | $174,000 | $35,927 | $138,073 |
| 2016 | $1,546 | $93,010 | $19,141 | $73,869 |
| 2015 | $1,361 | $83,019 | $19,141 | $63,878 |
| 2014 | $1,372 | $83,019 | $19,141 | $63,878 |
Source: Public Records
Map
Nearby Homes
- 283 3800 S 1900 W #283 Unit 283
- 4302 S 2325 W
- 4463 S 2900 W
- 2267 W 4350 S
- 4371 S 2900 W
- 2778 W 4175 S Unit 237
- 2802 W 4875 S
- 4164 S 2400 W
- 2782 W 4140 S Unit 249
- 4108 S 2835 W Unit 318
- 4108 S 2835 W Unit 317
- 4108 S 2835 W Unit 319
- 4108 S 2835 W Unit 320
- 2848 W 4075 S Unit 315
- 2848 W 4075 S Unit 316
- 2848 W 4075 S Unit 314
- 4931 S 2825 W
- 4046 Sandridge Dr Unit 3
- 4046 Sandridge Dr Unit 2
- 4046 Sandridge Dr Unit 4
Your Personal Tour Guide
Ask me questions while you tour the home.