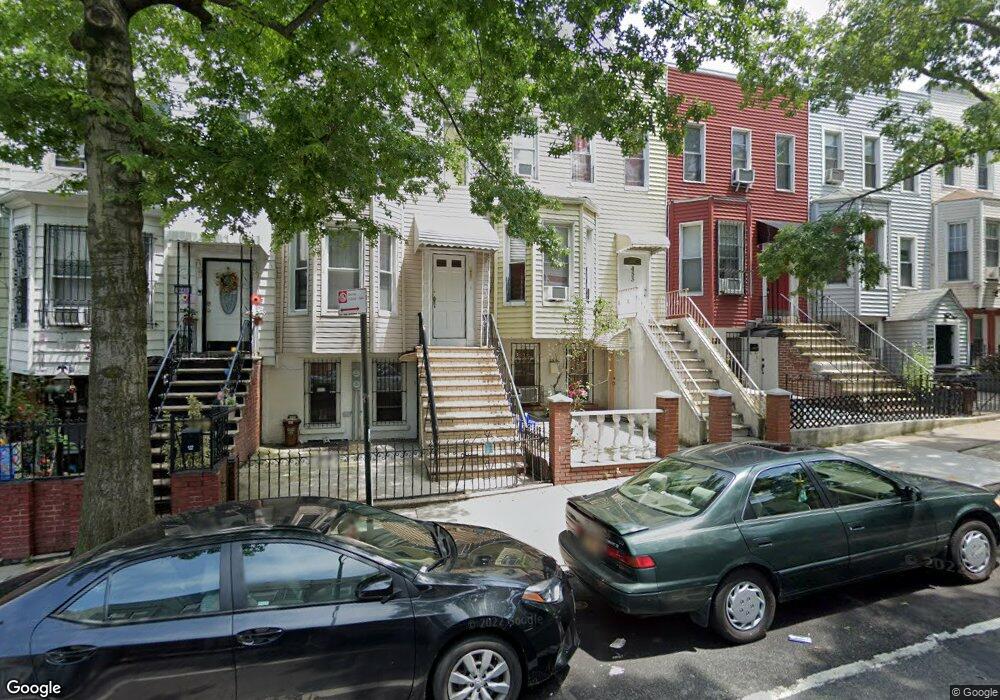
453 44 St Brooklyn, NY 11220
Sunset Park NeighborhoodEstimated Value: $1,096,700 - $1,371,000
5
Beds
2
Baths
1,680
Sq Ft
$744/Sq Ft
Est. Value
About This Home
This home is located at 453 44 St, Brooklyn, NY 11220 and is currently estimated at $1,249,925, approximately $744 per square foot. 453 44 St is a home located in Kings County with nearby schools including Sunset Park Avenue Elementary School and Tomer Devorah High School for Girls.
Ownership History
Date
Name
Owned For
Owner Type
Purchase Details
Closed on
Nov 8, 2019
Sold by
Suriel Maria
Bought by
453 44 St Corp
Current Estimated Value
Home Financials for this Owner
Home Financials are based on the most recent Mortgage that was taken out on this home.
Original Mortgage
$815,000
Outstanding Balance
$706,011
Interest Rate
3.6%
Estimated Equity
$543,914
Purchase Details
Closed on
Mar 6, 2006
Sold by
Firpi Martha
Bought by
Pena Rutila Maria
Create a Home Valuation Report for This Property
The Home Valuation Report is an in-depth analysis detailing your home's value as well as a comparison with similar homes in the area
Home Values in the Area
Average Home Value in this Area
Purchase History
We collect this data history from publicly available records. To have your information removed, we recommend requesting removal directly through your county’s website.
| Date | Buyer | Sale Price | Title Company |
|---|---|---|---|
| 453 44 St Corp | $885,000 | -- | |
| Pena Rutila Maria | $370,000 | -- |
Source: Public Records
Mortgage History
We collect this data history from publicly available records. To have your information removed, we recommend requesting removal directly through your county’s website.
| Date | Status | Borrower | Loan Amount |
|---|---|---|---|
| Open | 453 44 St Corp | $815,000 |
Source: Public Records
Tax History
| Year | Tax Paid | Tax Assessment Tax Assessment Total Assessment is a certain percentage of the fair market value that is determined by local assessors to be the total taxable value of land and additions on the property. | Land | Improvement |
|---|---|---|---|---|
| 2026 | $4,936 | $67,620 | $13,440 | $54,180 |
| 2025 | $4,663 | $64,320 | $13,440 | $50,880 |
| 2024 | $4,663 | $68,520 | $13,440 | $55,080 |
| 2023 | $4,715 | $78,900 | $13,440 | $65,460 |
| 2022 | $4,591 | $73,380 | $13,440 | $59,940 |
| 2021 | $4,569 | $62,760 | $13,440 | $49,320 |
| 2020 | $4,310 | $53,760 | $13,440 | $40,320 |
| 2019 | $4,047 | $50,760 | $13,440 | $37,320 |
| 2018 | $3,944 | $19,347 | $4,413 | $14,934 |
| 2017 | $3,907 | $19,166 | $4,495 | $14,671 |
| 2016 | $3,617 | $18,091 | $5,222 | $12,869 |
| 2015 | $2,181 | $17,067 | $5,758 | $11,309 |
| 2014 | $2,181 | $16,123 | $6,530 | $9,593 |
Source: Public Records
Map
Nearby Homes
Your Personal Tour Guide
Ask me questions while you tour the home.