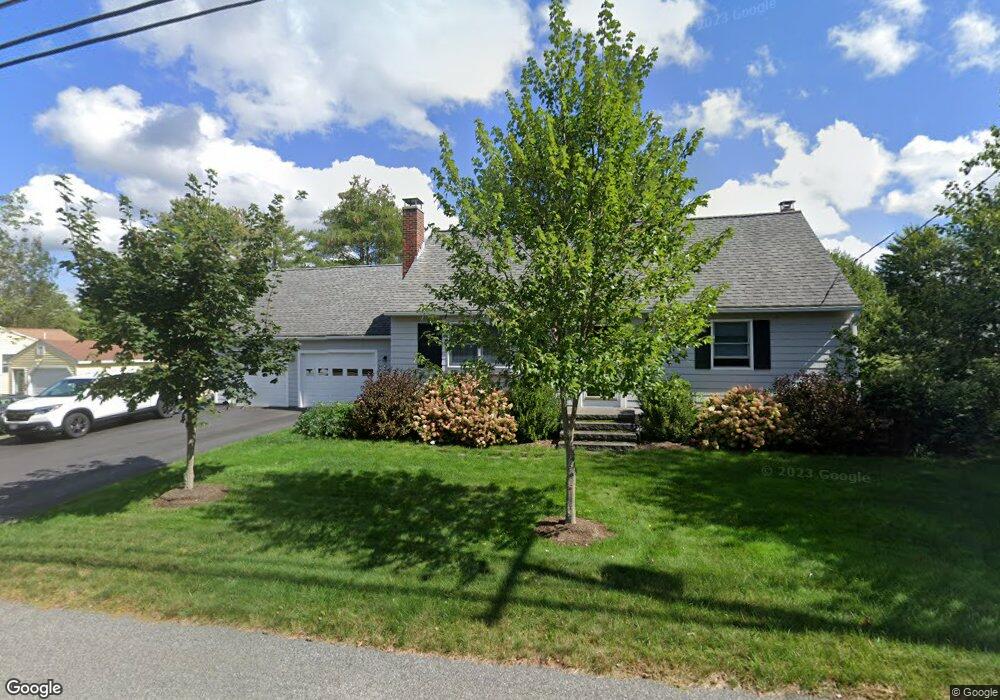
453 E Elm St Yarmouth, ME 04096
Estimated Value: $619,003 - $748,000
4
Beds
2
Baths
1,880
Sq Ft
$359/Sq Ft
Est. Value
About This Home
This home is located at 453 E Elm St, Yarmouth, ME 04096 and is currently estimated at $675,001, approximately $359 per square foot. 453 E Elm St is a home located in Cumberland County with nearby schools including William H. Rowe School, Yarmouth Elementary School, and Frank H. Harrison Middle School.
Ownership History
Date
Name
Owned For
Owner Type
Purchase Details
Closed on
Aug 16, 2007
Sold by
Lee Patrick and Lee Sharon A
Bought by
Lee Patrick and Lee Sharon A
Current Estimated Value
Create a Home Valuation Report for This Property
The Home Valuation Report is an in-depth analysis detailing your home's value as well as a comparison with similar homes in the area
Home Values in the Area
Average Home Value in this Area
Purchase History
We collect this data history from publicly available records. To have your information removed, we recommend requesting removal directly through your county’s website.
| Date | Buyer | Sale Price | Title Company |
|---|---|---|---|
| Lee Patrick | -- | -- |
Source: Public Records
Mortgage History
We collect this data history from publicly available records. To have your information removed, we recommend requesting removal directly through your county’s website.
| Date | Status | Borrower | Loan Amount |
|---|---|---|---|
| Closed | Lee Patrick | $95,000 |
Source: Public Records
Tax History
| Year | Tax Paid | Tax Assessment Tax Assessment Total Assessment is a certain percentage of the fair market value that is determined by local assessors to be the total taxable value of land and additions on the property. | Land | Improvement |
|---|---|---|---|---|
| 2025 | $8,270 | $568,400 | $109,000 | $459,400 |
| 2024 | $6,849 | $266,800 | $80,100 | $186,700 |
| 2023 | $6,280 | $266,800 | $80,100 | $186,700 |
| 2022 | $5,768 | $266,800 | $80,100 | $186,700 |
| 2021 | $4,837 | $266,800 | $80,100 | $186,700 |
| 2020 | $4,754 | $266,800 | $80,100 | $186,700 |
| 2019 | $5,032 | $266,800 | $80,100 | $186,700 |
| 2018 | $4,749 | $266,800 | $80,100 | $186,700 |
| 2017 | $4,578 | $266,800 | $80,100 | $186,700 |
| 2016 | $4,552 | $266,800 | $80,100 | $186,700 |
| 2015 | $4,892 | $226,900 | $66,800 | $160,100 |
| 2014 | $4,901 | $226,900 | $66,800 | $160,100 |
| 2013 | $4,992 | $226,900 | $0 | $0 |
Source: Public Records
Map
Nearby Homes
- 51 Old Field Rd
- 20 Island Park
- 177 Bluff Rd Unit 20
- 298 Main St Unit 2E
- 298 Main St Unit 3G
- 298 Main St Unit 3D
- 69 Summer St
- 37 South St
- 0 Bayview St
- 565 Sligo Rd
- 61 Yankee Dr
- 109 Main St
- 106 Village Brook Rd
- 11 Portland St
- 531 Ledge Rd
- 98 Harborview Dr
- 52 Blueberry Cove Rd Unit 52
- 15 Blueberry Cove
- 350 Hillside St
- 47 Glen Rd
Your Personal Tour Guide
Ask me questions while you tour the home.