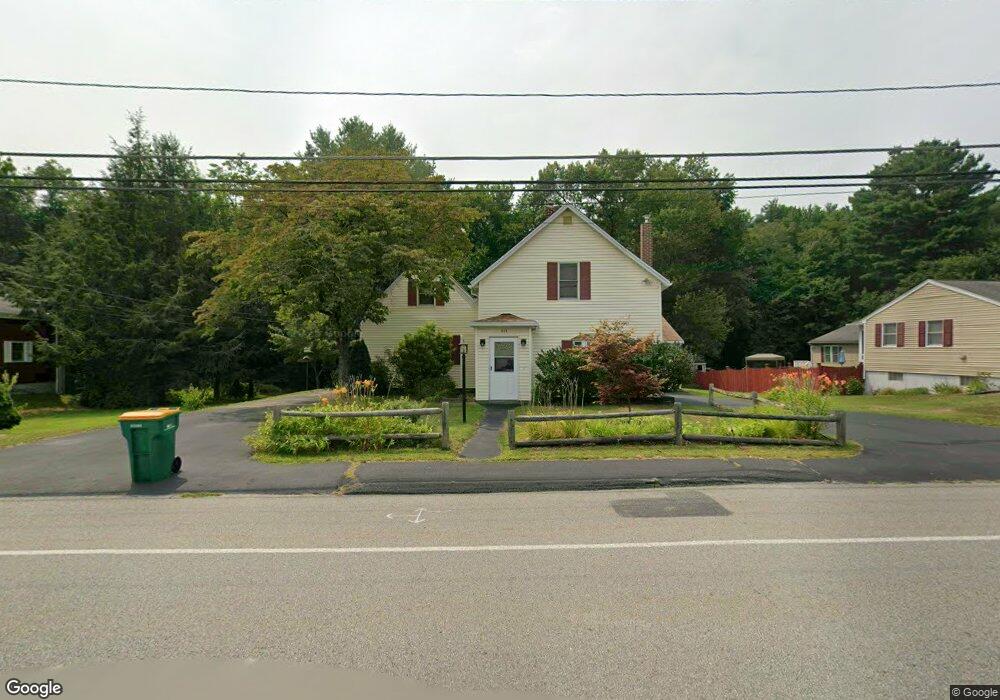
453 Elm St Mansfield, MA 02048
Estimated Value: $533,000 - $586,148
About This Home
This home is located at 453 Elm St, Mansfield, MA 02048 and is currently estimated at $565,537, approximately $411 per square foot. 453 Elm St is a home located in Bristol County with nearby schools including Everett W. Robinson Elementary School, Jordan/Jackson Elementary School, and Harold L. Qualters Middle School.
Ownership History
We collect this data history from publicly available records. To have your information removed, we recommend requesting removal directly through your county’s website.
Purchase Details
Purchase Details
Home Values in the Area
Average Home Value in this Area
Purchase History
We collect this data history from publicly available records. To have your information removed, we recommend requesting removal directly through your county’s website.
| Date | Buyer | Sale Price | Title Company |
|---|---|---|---|
| -- | None Available | ||
| -- | None Available | ||
| $148,000 | -- | ||
| $148,000 | -- |
Mortgage History
We collect this data history from publicly available records. To have your information removed, we recommend requesting removal directly through your county’s website.
| Date | Status | Borrower | Loan Amount |
|---|---|---|---|
| Previous Owner | $115,000 | ||
| Previous Owner | $136,000 | ||
| Previous Owner | $135,000 |
Tax History
We collect this data history from publicly available records. To have your information removed, we recommend requesting removal directly through your county’s website.
| Year | Tax Paid | Tax Assessment Tax Assessment Total Assessment is a certain percentage of the fair market value that is determined by local assessors to be the total taxable value of land and additions on the property. | Land | Improvement |
|---|---|---|---|---|
| 2025 | $6,302 | $478,500 | $232,200 | $246,300 |
| 2024 | $6,245 | $462,600 | $232,200 | $230,400 |
| 2023 | $6,095 | $432,600 | $232,200 | $200,400 |
| 2022 | $6,016 | $396,600 | $214,900 | $181,700 |
| 2021 | $5,507 | $358,500 | $188,100 | $170,400 |
| 2020 | $5,041 | $328,200 | $179,200 | $149,000 |
| 2019 | $4,823 | $316,900 | $149,300 | $167,600 |
| 2018 | $4,170 | $302,600 | $142,200 | $160,400 |
| 2017 | $4,440 | $295,600 | $138,000 | $157,600 |
| 2016 | $4,210 | $273,200 | $131,400 | $141,800 |
| 2015 | $4,058 | $261,800 | $131,400 | $130,400 |
Map
- 1125 School St
- 238 N Worcester St
- 174 Gilbert St
- 85 Jewell St
- 343 Godfrey Dr
- 49 Pheasant Hill Rd
- 14 Lancelot Ln
- 162 Godfrey Dr Unit 162
- 42 Colts Way
- 361 Richardson Ave
- 15 Reservoir St Unit 22
- 10 Anna Way
- 7 Village Way Unit C
- 1 Great Woods Cir
- 11 Village Way Unit F
- 100 Lakeview Ave
- 83 N Worcester St
- 82 N Worcester St
- 5 Juniper Dr
- 19 Barberry Rd
Ask me questions while you tour the home.