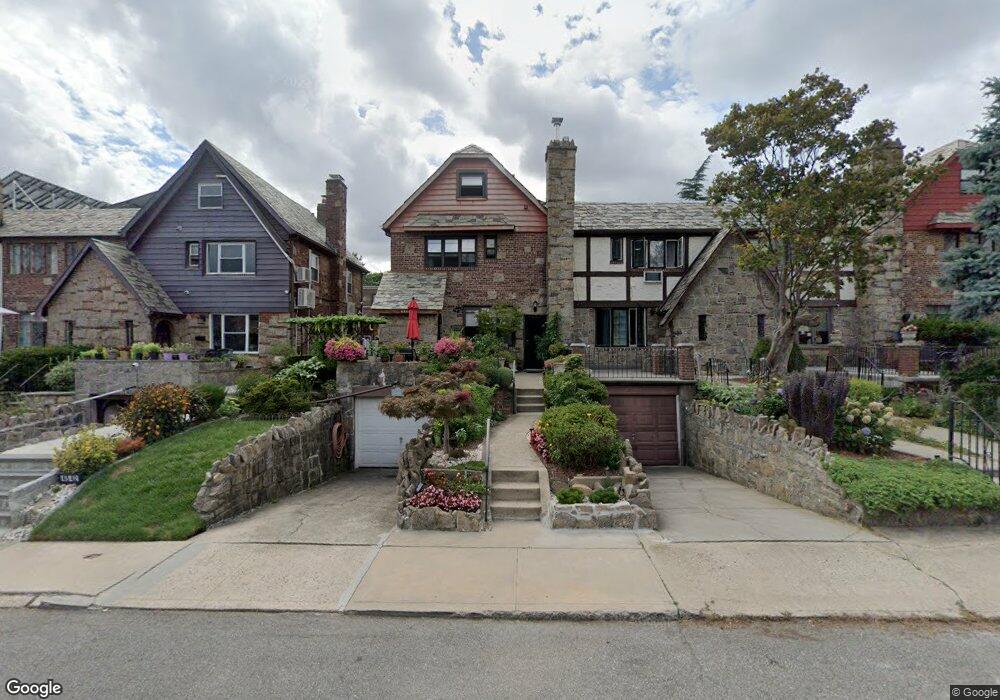
4538 194th St Flushing, NY 11358
Auburndale NeighborhoodEstimated Value: $1,013,000 - $1,104,000
Studio
--
Bath
1,520
Sq Ft
$689/Sq Ft
Est. Value
About This Home
This home is located at 4538 194th St, Flushing, NY 11358 and is currently estimated at $1,047,692, approximately $689 per square foot. 4538 194th St is a home located in Queens County with nearby schools including P.S. 107 Thomas A Dooley, I.S. 25 Adrien Block, and Francis Lewis High School.
Ownership History
Date
Name
Owned For
Owner Type
Purchase Details
Closed on
Apr 22, 2022
Sold by
Catherine Grigorians As Trustee
Bought by
Zou Shouming and Zou Yong Xing
Current Estimated Value
Home Financials for this Owner
Home Financials are based on the most recent Mortgage that was taken out on this home.
Original Mortgage
$550,000
Outstanding Balance
$515,596
Interest Rate
5.11%
Mortgage Type
Purchase Money Mortgage
Estimated Equity
$532,097
Purchase Details
Closed on
May 30, 2019
Sold by
Grigorians Nazely
Bought by
Grigorians Catherine and The Nazely Grigorians Irrevoca
Create a Home Valuation Report for This Property
The Home Valuation Report is an in-depth analysis detailing your home's value as well as a comparison with similar homes in the area
Home Values in the Area
Average Home Value in this Area
Purchase History
We collect this data history from publicly available records. To have your information removed, we recommend requesting removal directly through your county’s website.
| Date | Buyer | Sale Price | Title Company |
|---|---|---|---|
| Zou Shouming | $965,000 | -- | |
| Grigorians Catherine | -- | -- |
Source: Public Records
Mortgage History
We collect this data history from publicly available records. To have your information removed, we recommend requesting removal directly through your county’s website.
| Date | Status | Borrower | Loan Amount |
|---|---|---|---|
| Open | Zou Shouming | $550,000 |
Source: Public Records
Tax History
| Year | Tax Paid | Tax Assessment Tax Assessment Total Assessment is a certain percentage of the fair market value that is determined by local assessors to be the total taxable value of land and additions on the property. | Land | Improvement |
|---|---|---|---|---|
| 2026 | $9,219 | $45,916 | $12,021 | $33,895 |
| 2025 | $8,955 | $45,899 | $13,142 | $32,757 |
| 2024 | $8,955 | $44,587 | $13,105 | $31,482 |
| 2023 | $8,549 | $42,564 | $12,497 | $30,067 |
| 2022 | $8,068 | $50,760 | $15,960 | $34,800 |
| 2021 | $8,052 | $53,100 | $15,960 | $37,140 |
| 2020 | $8,096 | $54,000 | $15,960 | $38,040 |
| 2019 | $7,773 | $54,420 | $15,960 | $38,460 |
| 2018 | $7,231 | $35,470 | $11,286 | $24,184 |
| 2017 | $6,865 | $33,679 | $11,226 | $22,453 |
| 2016 | $6,374 | $33,679 | $11,226 | $22,453 |
| 2015 | -- | $31,874 | $14,268 | $17,606 |
| 2014 | -- | $30,964 | $16,638 | $14,326 |
Source: Public Records
Map
Nearby Homes
- 45-31 195th St
- 4552 196th St
- 46-29 194th St
- 46-12 196th St
- 19519 45th Ave
- 43-44 195th St
- 45-63 189th St
- 196-52 45th Dr
- 196-64 45th Ave
- 47-55 194th St
- 47-36 196th St
- 45-01 Utopia Pkwy
- 47-49 194th St
- 4240 192nd St
- 45-32 Utopia Pkwy
- 4735 196th Place
- 4705 189th St
- 43-53 172nd St
- 171-73 46th Ave
- 4716 189th St
Your Personal Tour Guide
Ask me questions while you tour the home.