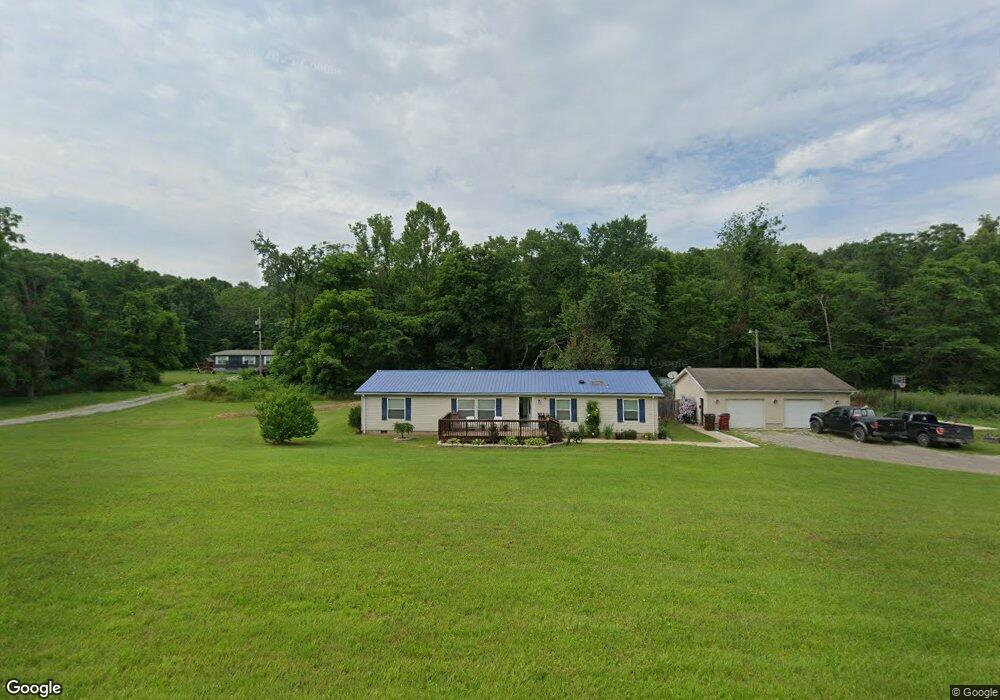
454 Landman Rd Waverly, OH 45690
Estimated Value: $162,000 - $251,639
3
Beds
2
Baths
1,680
Sq Ft
$122/Sq Ft
Est. Value
About This Home
This home is located at 454 Landman Rd, Waverly, OH 45690 and is currently estimated at $205,160, approximately $122 per square foot. 454 Landman Rd is a home located in Ross County with nearby schools including Huntington Elementary School, Huntington Middle School, and Huntington High School.
Ownership History
Date
Name
Owned For
Owner Type
Purchase Details
Closed on
Dec 15, 2017
Sold by
Shaw Michael E and Shaw Mary Ann
Bought by
Kellough Kaile B
Current Estimated Value
Purchase Details
Closed on
Jun 12, 2015
Sold by
Shaw Jeremy M and Shaw Elizabeth
Bought by
Kellough Kailee B
Home Financials for this Owner
Home Financials are based on the most recent Mortgage that was taken out on this home.
Original Mortgage
$82,478
Interest Rate
3.87%
Mortgage Type
FHA
Create a Home Valuation Report for This Property
The Home Valuation Report is an in-depth analysis detailing your home's value as well as a comparison with similar homes in the area
Purchase History
We collect this data history from publicly available records. To have your information removed, we recommend requesting removal directly through your county’s website.
| Date | Buyer | Sale Price | Title Company |
|---|---|---|---|
| Kellough Kaile B | $45,000 | None Available | |
| Kellough Kailee B | $84,000 | Northwest Title Family Compa |
Source: Public Records
Mortgage History
We collect this data history from publicly available records. To have your information removed, we recommend requesting removal directly through your county’s website.
| Date | Status | Borrower | Loan Amount |
|---|---|---|---|
| Previous Owner | Kellough Kailee B | $82,478 |
Source: Public Records
Tax History
| Year | Tax Paid | Tax Assessment Tax Assessment Total Assessment is a certain percentage of the fair market value that is determined by local assessors to be the total taxable value of land and additions on the property. | Land | Improvement |
|---|---|---|---|---|
| 2025 | $2,304 | $72,170 | $5,400 | $66,770 |
| 2024 | $2,081 | $57,950 | $4,390 | $53,560 |
| 2023 | $2,081 | $57,950 | $4,390 | $53,560 |
| 2022 | $2,100 | $57,950 | $4,390 | $53,560 |
| 2021 | $1,633 | $42,610 | $3,150 | $39,460 |
| 2020 | $1,630 | $42,610 | $3,150 | $39,460 |
| 2019 | $1,669 | $42,610 | $3,150 | $39,460 |
| 2018 | $1,489 | $37,070 | $3,050 | $34,020 |
| 2017 | $1,495 | $37,070 | $3,050 | $34,020 |
| 2016 | $1,460 | $37,070 | $3,050 | $34,020 |
| 2015 | $1,566 | $39,190 | $3,050 | $36,140 |
| 2014 | $1,472 | $39,190 | $3,050 | $36,140 |
| 2013 | $1,479 | $39,190 | $3,050 | $36,140 |
Source: Public Records
Map
Nearby Homes
- Summit Hill
- 613 Harris Station Rd
- 591 Harris Station Rd
- 250 Easterday Rd
- 173 Easterday Rd Unit 173
- 0 Camelin Hill Rd
- 17 Camelin Hill Rd
- 379 Mount Tabor Rd
- 3409 Clines Chapel Rd
- 7149 Potts Hill Rd
- 2562 Black Run Rd
- 987 Windy Ridge Rd
- 765 Carl Penn Rd
- 973 Golf Course Rd
- 3200 Black Run Rd
- 100 Golf Course Rd
- 100 Golf Course Rd Unit (Tract 12 Skyline Ac
- 56 Golf Course Rd
- 56 Golf Course Rd Unit (Tract 14 SkylineAcr
- 5305 Clines Chapel Rd Unit (Tract 15 SkylineAcr
Your Personal Tour Guide
Ask me questions while you tour the home.