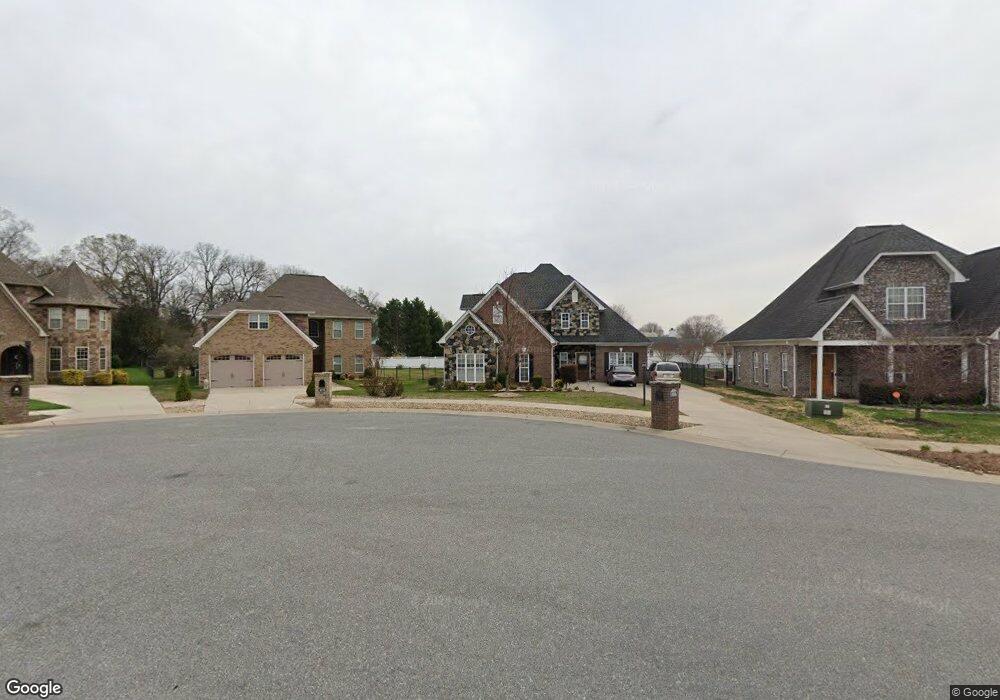
4566 Lanstone Ct SW Concord, NC 28027
Estimated Value: $496,175 - $552,000
3
Beds
3
Baths
2,421
Sq Ft
$213/Sq Ft
Est. Value
About This Home
This home is located at 4566 Lanstone Ct SW, Concord, NC 28027 and is currently estimated at $515,544, approximately $212 per square foot. 4566 Lanstone Ct SW is a home located in Cabarrus County with nearby schools including Pitts School Road Elementary School, Roberta Road Middle School, and Jay M. Robinson High School.
Ownership History
Date
Name
Owned For
Owner Type
Purchase Details
Closed on
Feb 11, 2009
Sold by
The King Corporation Of Charlotte Inc
Bought by
Fortier Thomas R and Fortier Eugenie G
Current Estimated Value
Purchase Details
Closed on
Apr 7, 2006
Sold by
Ck Corp Of The Carolinas Inc
Bought by
Fortier Thomas R and Fortier Eugenie G
Home Financials for this Owner
Home Financials are based on the most recent Mortgage that was taken out on this home.
Original Mortgage
$40,800
Interest Rate
5.89%
Mortgage Type
Unknown
Purchase Details
Closed on
Nov 9, 2005
Sold by
The King Corp Of Charlotte Inc
Bought by
Ck Corp Of The Carolinas Inc
Home Financials for this Owner
Home Financials are based on the most recent Mortgage that was taken out on this home.
Original Mortgage
$46,000
Interest Rate
5.84%
Mortgage Type
Construction
Create a Home Valuation Report for This Property
The Home Valuation Report is an in-depth analysis detailing your home's value as well as a comparison with similar homes in the area
Home Values in the Area
Average Home Value in this Area
Purchase History
| Date | Buyer | Sale Price | Title Company |
|---|---|---|---|
| Fortier Thomas R | -- | None Available | |
| Fortier Thomas R | $272,000 | None Available | |
| Ck Corp Of The Carolinas Inc | $46,000 | -- |
Source: Public Records
Mortgage History
| Date | Status | Borrower | Loan Amount |
|---|---|---|---|
| Previous Owner | Fortier Thomas R | $40,800 | |
| Previous Owner | Fortier Thomas R | $217,600 | |
| Previous Owner | Ck Corp Of The Carolinas Inc | $46,000 |
Source: Public Records
Tax History
| Year | Tax Paid | Tax Assessment Tax Assessment Total Assessment is a certain percentage of the fair market value that is determined by local assessors to be the total taxable value of land and additions on the property. | Land | Improvement |
|---|---|---|---|---|
| 2025 | $4,632 | $465,020 | $110,000 | $355,020 |
| 2024 | $4,632 | $465,020 | $110,000 | $355,020 |
| 2023 | $3,294 | $270,020 | $50,000 | $220,020 |
| 2022 | $3,294 | $270,020 | $50,000 | $220,020 |
| 2021 | $3,294 | $270,020 | $50,000 | $220,020 |
| 2020 | $3,294 | $270,020 | $50,000 | $220,020 |
| 2019 | $2,995 | $245,480 | $38,000 | $207,480 |
| 2018 | $2,902 | $241,850 | $38,000 | $203,850 |
| 2017 | $2,854 | $241,850 | $38,000 | $203,850 |
| 2016 | $1,693 | $263,530 | $45,000 | $218,530 |
| 2015 | $3,110 | $263,530 | $45,000 | $218,530 |
| 2014 | $3,110 | $263,530 | $45,000 | $218,530 |
Source: Public Records
Map
Nearby Homes
- 4570 Lanstone Ct SW
- 706 King Fredrick Ln SW
- 4463 Legend St SW
- 781 King Fredrick Ln SW Unit 207
- 3947 Longwood Dr SW
- 4476 Greystone Dr SW
- 4266 Barley St SW
- 4122 Amarillo Dr SW
- 3887 Longwood Dr SW
- 4178 Morris Burn Dr SW
- 4271 Maybrook Ct SW
- 4333 Glen Eagles Ln SW
- 4349 Roberta Rd
- 842 Treva Anne Dr SW
- 855 Juanita Dr SW
- 5421 Roberta Meadows Ct
- 5361 Brickyard Terrace Ct
- 5307 Bendix Ct
- 4444 Bravery Place SW Unit 116
- 3455 Roberta Rd
- 4558 Lanstone Ct SW
- 4574 Lanstone Ct SW
- 4563 Cochran Farm Rd SW
- 4563 Cochran Farm Rd SW Unit 11
- 4567 Cochran Farm Rd SW
- 4554 Lanstone Ct SW Unit Lot 30
- 4554 Lanstone Ct SW
- 4571 Cochran Farm Rd SW
- 4577 Lanstone Ct SW
- 4559 Cochran Farm Rd SW
- 4565 Lanstone Ct SW
- 4575 Cochran Farm Rd SW
- 4561 Lanstone Ct SW
- 4561 Lanstone Ct SW Unit 20
- 4557 Lanstone Ct SW Unit Lot 19
- 4557 Lanstone Ct SW
- 4540 Lanstone Ct SW
- 4569 Lanstone Ct SW
- 4555 Cochran Farm Rd SW
- 4573 Lanstone Ct SW
Your Personal Tour Guide
Ask me questions while you tour the home.