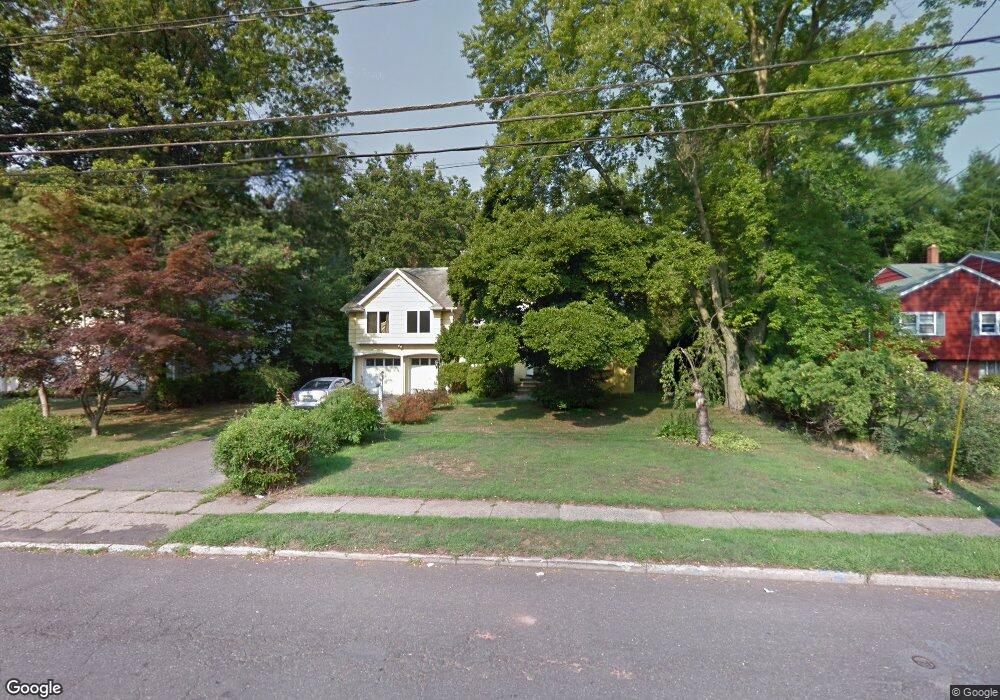
457 Piermont Rd Cresskill, NJ 07626
Estimated Value: $944,000 - $1,670,088
Studio
--
Bath
4,471
Sq Ft
$299/Sq Ft
Est. Value
About This Home
This home is located at 457 Piermont Rd, Cresskill, NJ 07626 and is currently estimated at $1,337,022, approximately $299 per square foot. 457 Piermont Rd is a home located in Bergen County with nearby schools including County Road Elementary School, Demarest Middle School, and Luther Lee Emerson Elementary School.
Ownership History
Date
Name
Owned For
Owner Type
Purchase Details
Closed on
Jun 7, 2017
Sold by
Viardo Natalia
Bought by
Viardo Alexander
Current Estimated Value
Home Financials for this Owner
Home Financials are based on the most recent Mortgage that was taken out on this home.
Original Mortgage
$550,000
Outstanding Balance
$457,861
Interest Rate
4.05%
Mortgage Type
New Conventional
Estimated Equity
$879,161
Purchase Details
Closed on
Oct 14, 2008
Create a Home Valuation Report for This Property
The Home Valuation Report is an in-depth analysis detailing your home's value as well as a comparison with similar homes in the area
Home Values in the Area
Average Home Value in this Area
Purchase History
| Date | Buyer | Sale Price | Title Company |
|---|---|---|---|
| Viardo Alexander | -- | None Available | |
| -- | -- | -- |
Source: Public Records
Mortgage History
| Date | Status | Borrower | Loan Amount |
|---|---|---|---|
| Open | Viardo Alexander | $550,000 |
Source: Public Records
Tax History
| Year | Tax Paid | Tax Assessment Tax Assessment Total Assessment is a certain percentage of the fair market value that is determined by local assessors to be the total taxable value of land and additions on the property. | Land | Improvement |
|---|---|---|---|---|
| 2025 | $21,040 | $969,200 | $493,800 | $475,400 |
| 2024 | $20,734 | $914,800 | $457,800 | $457,000 |
| 2023 | $19,814 | $893,300 | $448,800 | $444,500 |
| 2022 | $19,814 | $823,200 | $397,600 | $425,600 |
| 2021 | $19,734 | $808,100 | $395,300 | $412,800 |
| 2020 | $18,848 | $775,000 | $391,700 | $383,300 |
| 2019 | $20,103 | $835,200 | $388,600 | $446,600 |
| 2018 | $13,974 | $828,800 | $385,900 | $442,900 |
| 2017 | $16,604 | $610,000 | $238,700 | $371,300 |
| 2016 | $16,110 | $610,000 | $238,700 | $371,300 |
| 2015 | $15,610 | $610,000 | $238,700 | $371,300 |
| 2014 | $16,170 | $651,500 | $238,700 | $412,800 |
Source: Public Records
Map
Nearby Homes
Your Personal Tour Guide
Ask me questions while you tour the home.