Estimated Value: $69,000 - $134,000
2
Beds
1
Bath
960
Sq Ft
$96/Sq Ft
Est. Value
About This Home
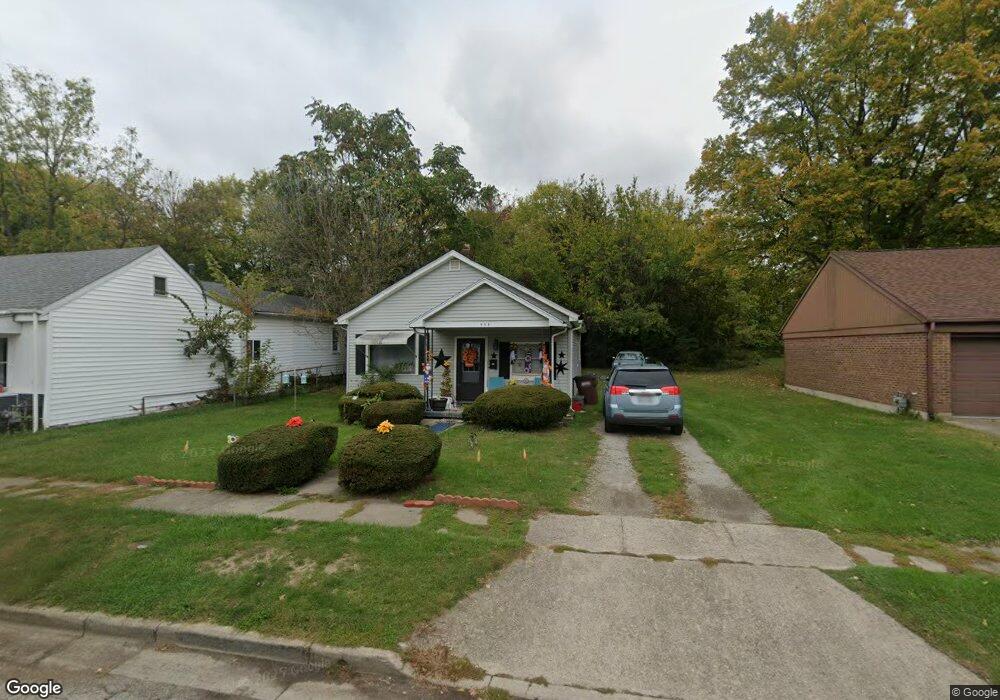
This home is located at 458 E 3rd St, Xenia, OH 45385 and is currently estimated at $91,764, approximately $95 per square foot. 458 E 3rd St is a home located in Greene County with nearby schools including Xenia High School, Summit Academy Community School for Alternative Learners - Xenia, and Legacy Christian Academy.
Ownership History
Date
Name
Owned For
Owner Type
Purchase Details
Closed on
Jul 31, 2008
Sold by
Davenport John W and Davenport Lenora V
Bought by
Davenport Dewey D
Current Estimated Value
Home Financials for this Owner
Home Financials are based on the most recent Mortgage that was taken out on this home.
Original Mortgage
$24,300
Outstanding Balance
$15,685
Interest Rate
6.51%
Mortgage Type
Unknown
Estimated Equity
$76,079
Purchase Details
Closed on
Aug 11, 2005
Sold by
Davenport John and Davenport Lenora V
Bought by
Davenport John W and Davenport Lenora
Create a Home Valuation Report for This Property
The Home Valuation Report is an in-depth analysis detailing your home's value as well as a comparison with similar homes in the area
Home Values in the Area
Average Home Value in this Area
Purchase History
We collect this data history from publicly available records. To have your information removed, we recommend requesting removal directly through your county’s website.
| Date | Buyer | Sale Price | Title Company |
|---|---|---|---|
| Davenport Dewey D | $27,000 | Attorney | |
| Davenport John W | -- | -- |
Source: Public Records
Mortgage History
We collect this data history from publicly available records. To have your information removed, we recommend requesting removal directly through your county’s website.
| Date | Status | Borrower | Loan Amount |
|---|---|---|---|
| Open | Davenport Dewey D | $24,300 |
Source: Public Records
Tax History
| Year | Tax Paid | Tax Assessment Tax Assessment Total Assessment is a certain percentage of the fair market value that is determined by local assessors to be the total taxable value of land and additions on the property. | Land | Improvement |
|---|---|---|---|---|
| 2025 | $591 | $13,580 | $1,980 | $11,600 |
| 2024 | $591 | $13,580 | $1,980 | $11,600 |
| 2023 | $581 | $13,580 | $1,980 | $11,600 |
| 2022 | $493 | $9,820 | $1,800 | $8,020 |
| 2021 | $499 | $9,820 | $1,800 | $8,020 |
| 2020 | $329 | $9,820 | $1,800 | $8,020 |
| 2019 | $329 | $6,350 | $1,830 | $4,520 |
| 2018 | $330 | $6,350 | $1,830 | $4,520 |
| 2017 | $320 | $6,350 | $1,830 | $4,520 |
| 2016 | $325 | $6,140 | $1,830 | $4,310 |
| 2015 | $326 | $6,140 | $1,830 | $4,310 |
| 2014 | $312 | $6,140 | $1,830 | $4,310 |
Source: Public Records
Map
Nearby Homes
- 0 E 2nd St
- 607 E Main St
- 149 Third
- 454 E Church St
- 645 E Church St
- 591 Kennedy St
- 422 N Columbus St
- 75 W 2nd St
- 400 S Detroit St
- 0 N Patton St
- 00 N Patton St
- 573 Louise Dr
- 770 S Columbus St
- 119 S Galloway St
- 614 Louise Dr
- 603 Louise Dr
- 523 S Detroit St
- 150-150 1/2 W Church St
- 300 N King St
- 150 High St
Your Personal Tour Guide
Ask me questions while you tour the home.