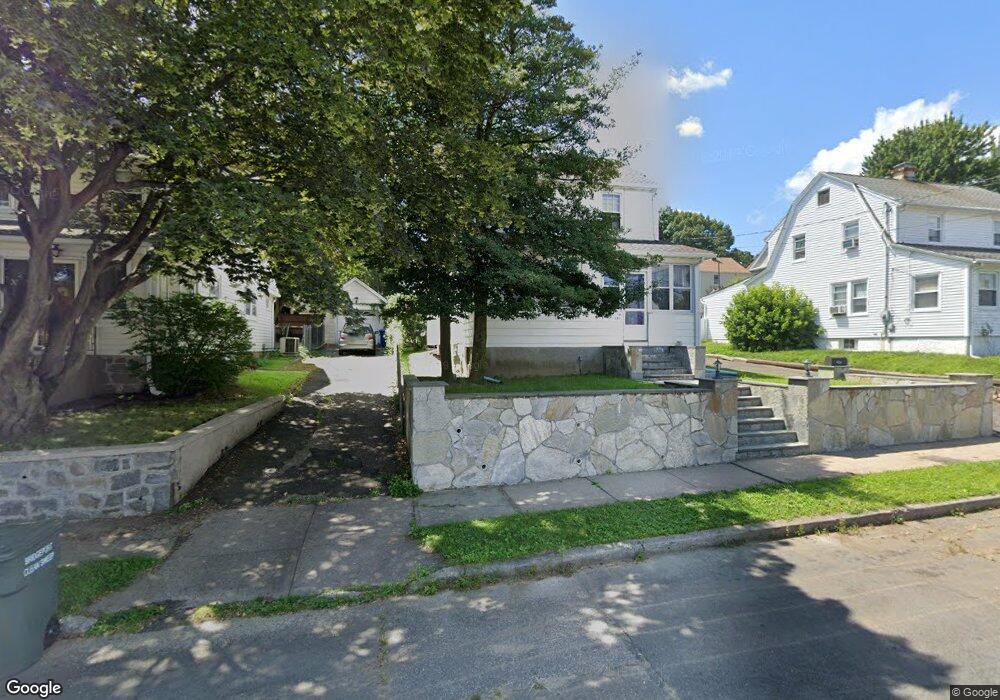
459 Ezra St Bridgeport, CT 06606
North End NeighborhoodEstimated Value: $376,000 - $422,000
About This Home
This home is located at 459 Ezra St, Bridgeport, CT 06606 and is currently estimated at $405,084, approximately $272 per square foot. 459 Ezra St is a home located in Fairfield County with nearby schools including Blackham School, Central High School, and Northeastern Adventist Academy - Fairfield County.
Ownership History
We collect this data history from publicly available records. To have your information removed, we recommend requesting removal directly through your county’s website.
Purchase Details
Home Financials for this Owner
Home Financials are based on the most recent Mortgage that was taken out on this home.Purchase Details
Home Financials for this Owner
Home Financials are based on the most recent Mortgage that was taken out on this home.Home Values in the Area
Average Home Value in this Area
Purchase History
We collect this data history from publicly available records. To have your information removed, we recommend requesting removal directly through your county’s website.
| Date | Buyer | Sale Price | Title Company |
|---|---|---|---|
| $127,000 | -- | ||
| $127,000 | -- | ||
| $94,000 | -- | ||
| $94,000 | -- |
Mortgage History
We collect this data history from publicly available records. To have your information removed, we recommend requesting removal directly through your county’s website.
| Date | Status | Borrower | Loan Amount |
|---|---|---|---|
| Open | $126,100 | ||
| Closed | $126,100 | ||
| Previous Owner | $84,600 | ||
| Closed | $4,700 |
Tax History
We collect this data history from publicly available records. To have your information removed, we recommend requesting removal directly through your county’s website.
| Year | Tax Paid | Tax Assessment Tax Assessment Total Assessment is a certain percentage of the fair market value that is determined by local assessors to be the total taxable value of land and additions on the property. | Land | Improvement |
|---|---|---|---|---|
| 2025 | $6,196 | $142,610 | $70,120 | $72,490 |
| 2024 | $6,196 | $142,610 | $70,120 | $72,490 |
| 2023 | $6,017 | $138,490 | $70,120 | $68,370 |
| 2022 | $6,017 | $138,490 | $70,120 | $68,370 |
| 2021 | $6,017 | $138,490 | $70,120 | $68,370 |
| 2020 | $5,700 | $105,580 | $42,490 | $63,090 |
| 2018 | $5,740 | $105,580 | $42,490 | $63,090 |
| 2015 | $5,298 | $125,540 | $42,840 | $82,700 |
| 2014 | $5,298 | $125,540 | $42,840 | $82,700 |
Map
- 1184 Lindley St
- 124 Harmony St
- 926 Hart St
- 916 Hart St
- 107 Fairview Ave Unit 109
- 265 Greenwood St
- 150 Summit St
- 25 Oakwood St
- 3193 Main St
- 366 Harmony St
- 25 Westfield Ave
- 95-97 Savoy St
- 420 Greenwood St
- 56 Higgins Ave
- 3460 Main St
- 3461 Main St
- 157 Anson St
- 228 Westfield Ave
- 533 Wayne St
- 113 Clark St
- 1216 Lindley St Unit 1218
- 1214 Lindley St
- 1190 Lindley St Unit 1194
- 1234 Lindley St
- 1235 Lindley St
- 449 Ezra St
- 1227 Lindley St Unit 1229
- 340 Summit St
- 1219 Lindley St Unit 3rd
- 1215 Lindley St Unit 3rd
- 1215 Lindley St Unit 2nd
- 1215 Lindley St Unit 1219
- 1215 Lindley St Unit 1218
- 1215 Lindley St Unit 1st
- 441 Ezra St
- 1244 Lindley St
- 1217 Lindley St Unit 2nd
- 1225 Lindley St
- 469 Ezra St
- 318 Summit St
Ask me questions while you tour the home.