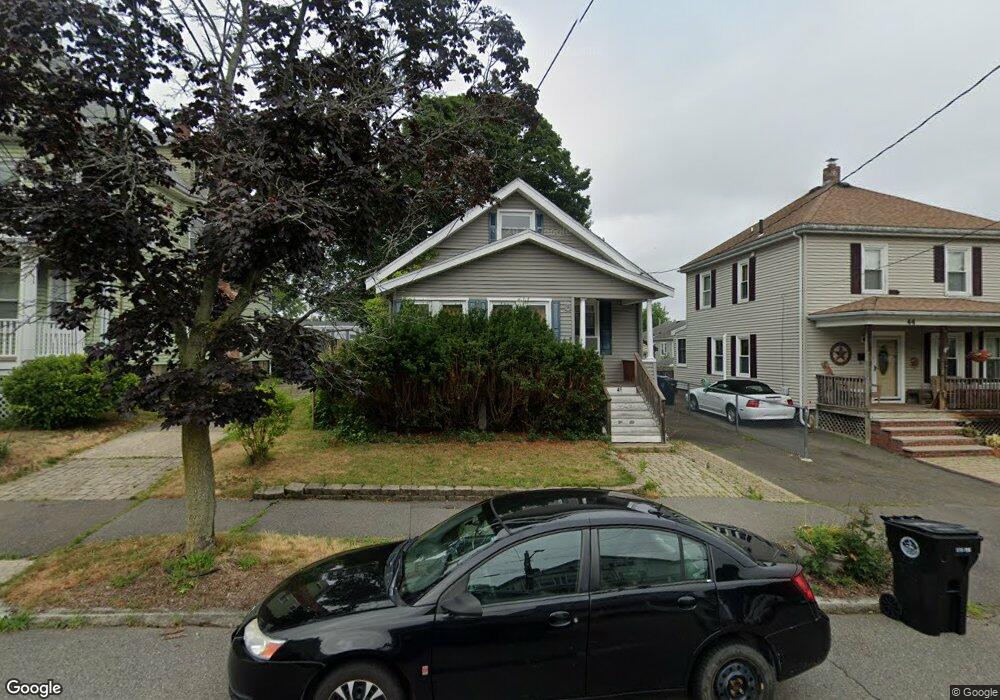
46 Dunlap St Salem, MA 01970
North Salem NeighborhoodEstimated Value: $561,000 - $602,000
About This Home
This home is located at 46 Dunlap St, Salem, MA 01970 and is currently estimated at $582,078, approximately $487 per square foot. 46 Dunlap St is a home located in Essex County with nearby schools including Bates Elementary School, Carlton Elementary School, and Saltonstall School.
Ownership History
We collect this data history from publicly available records. To have your information removed, we recommend requesting removal directly through your county’s website.
Purchase Details
Purchase Details
Home Values in the Area
Average Home Value in this Area
Purchase History
We collect this data history from publicly available records. To have your information removed, we recommend requesting removal directly through your county’s website.
| Date | Buyer | Sale Price | Title Company |
|---|---|---|---|
| $184,500 | -- | ||
| $106,000 | -- |
Mortgage History
We collect this data history from publicly available records. To have your information removed, we recommend requesting removal directly through your county’s website.
| Date | Status | Borrower | Loan Amount |
|---|---|---|---|
| Open | $82,600 | ||
| Open | $203,200 | ||
| Closed | $187,000 |
Tax History
We collect this data history from publicly available records. To have your information removed, we recommend requesting removal directly through your county’s website.
| Year | Tax Paid | Tax Assessment Tax Assessment Total Assessment is a certain percentage of the fair market value that is determined by local assessors to be the total taxable value of land and additions on the property. | Land | Improvement |
|---|---|---|---|---|
| 2025 | $5,375 | $474,000 | $201,900 | $272,100 |
| 2024 | $5,198 | $447,300 | $191,800 | $255,500 |
| 2023 | $4,999 | $399,600 | $177,100 | $222,500 |
| 2022 | $4,929 | $372,000 | $171,200 | $200,800 |
| 2021 | $4,847 | $351,200 | $159,400 | $191,800 |
| 2020 | $4,685 | $324,200 | $150,500 | $173,700 |
| 2019 | $4,660 | $308,600 | $142,800 | $165,800 |
| 2018 | $4,517 | $293,700 | $135,800 | $157,900 |
| 2017 | $4,178 | $263,400 | $114,500 | $148,900 |
| 2016 | $4,044 | $258,100 | $109,200 | $148,900 |
| 2015 | $3,942 | $240,200 | $100,300 | $139,900 |
Map
- 44 School St Unit 1
- 42 School St Unit 2
- 6 Harmony St
- 31 Symonds St Unit 20
- 57 Buffum St Unit 1
- 137 North St Unit 3
- 18 Balcomb St Unit B
- 18 Balcomb St
- 39 Mason St
- 24 Mason St
- 181 North St Unit 105
- 146 North St Unit 4
- 146 North St Unit 1
- 12 Waters St
- 12 1/2 Dearborn St Unit 2
- 10 Osborne St Unit B
- 99 Mason St Unit 2
- 144 Tremont St
- 15 River St
- 2 Andover St Unit B
- 44 Dunlap St
- 48 Dunlap St
- 50 Dunlap St
- 77A Barstow St
- 40 Dunlap St
- 79 Barstow St
- 73 Barstow St
- 81 Barstow St
- 77 Barstow St
- 49 Dunlap St Unit 2
- 38 Dunlap St
- 69 Barstow St Unit 71
- 69 Barstow St Unit 1
- 45 Dunlap St
- 83 Barstow St
- 49 Dunlap St Unit 2
- 49 Dunlap St Unit 1
- 36 Dunlap St
- 43 Dunlap St
- 51 Dunlap St
Ask me questions while you tour the home.