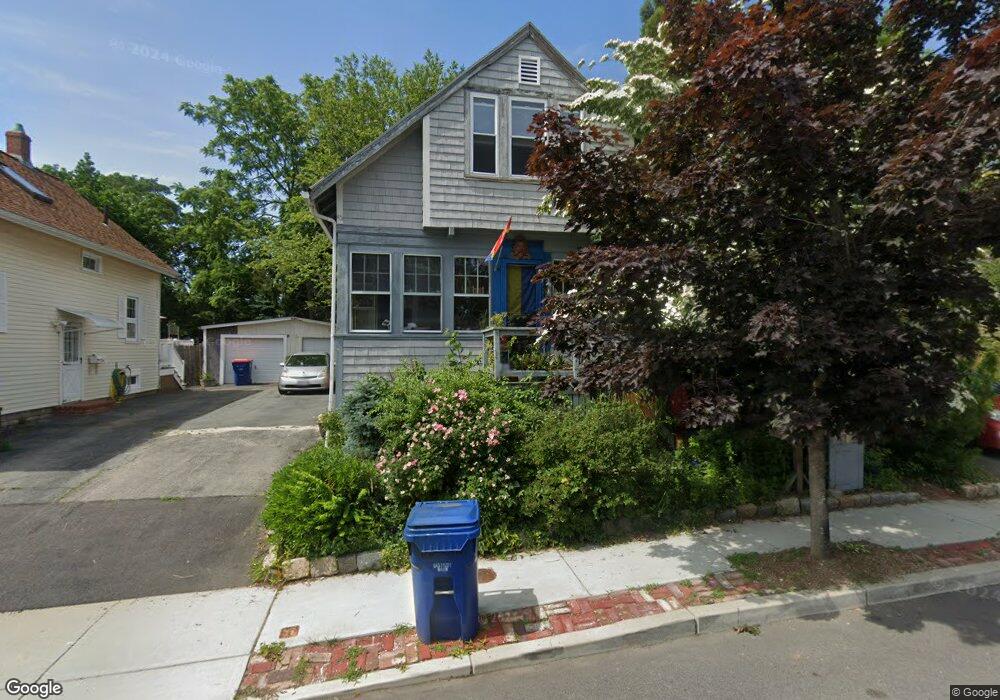
46 Hedge St Fairhaven, MA 02719
Oxford NeighborhoodEstimated Value: $364,302 - $466,000
2
Beds
1
Bath
710
Sq Ft
$586/Sq Ft
Est. Value
About This Home
This home is located at 46 Hedge St, Fairhaven, MA 02719 and is currently estimated at $415,826, approximately $585 per square foot. 46 Hedge St is a home located in Bristol County with nearby schools including Fairhaven High School, Alma Del Mar Charter School, and City On A Hill Charter Public School New Bedford.
Ownership History
Date
Name
Owned For
Owner Type
Purchase Details
Closed on
Jun 27, 2002
Sold by
Newton Mark and Newton Rebecca
Bought by
Richard Ann-Margaret
Current Estimated Value
Purchase Details
Closed on
Jul 7, 1993
Sold by
South St Rt and Lehrberg Roger J F
Bought by
Raynham Nursing Ctr
Create a Home Valuation Report for This Property
The Home Valuation Report is an in-depth analysis detailing your home's value as well as a comparison with similar homes in the area
Home Values in the Area
Average Home Value in this Area
Purchase History
| Date | Buyer | Sale Price | Title Company |
|---|---|---|---|
| Richard Ann-Margaret | $140,000 | -- | |
| Raynham Nursing Ctr | $386,334 | -- |
Source: Public Records
Mortgage History
| Date | Status | Borrower | Loan Amount |
|---|---|---|---|
| Open | Raynham Nursing Ctr | $197,600 | |
| Closed | Raynham Nursing Ctr | $185,000 | |
| Closed | Raynham Nursing Ctr | $157,500 | |
| Closed | Raynham Nursing Ctr | $141,000 |
Source: Public Records
Tax History
| Year | Tax Paid | Tax Assessment Tax Assessment Total Assessment is a certain percentage of the fair market value that is determined by local assessors to be the total taxable value of land and additions on the property. | Land | Improvement |
|---|---|---|---|---|
| 2025 | $29 | $312,600 | $174,000 | $138,600 |
| 2024 | $2,824 | $306,000 | $174,000 | $132,000 |
| 2023 | $2,746 | $276,000 | $152,400 | $123,600 |
| 2022 | $2,662 | $260,500 | $141,600 | $118,900 |
| 2021 | $3,366 | $225,200 | $128,100 | $97,100 |
| 2020 | $2,491 | $225,200 | $128,100 | $97,100 |
| 2019 | $5,020 | $196,300 | $106,300 | $90,000 |
| 2018 | $761 | $186,200 | $101,200 | $85,000 |
| 2017 | $0 | $180,000 | $101,200 | $78,800 |
| 2016 | $2,117 | $173,800 | $101,200 | $72,600 |
| 2015 | $2,092 | $172,200 | $101,200 | $71,000 |
Source: Public Records
Map
Nearby Homes
Your Personal Tour Guide
Ask me questions while you tour the home.