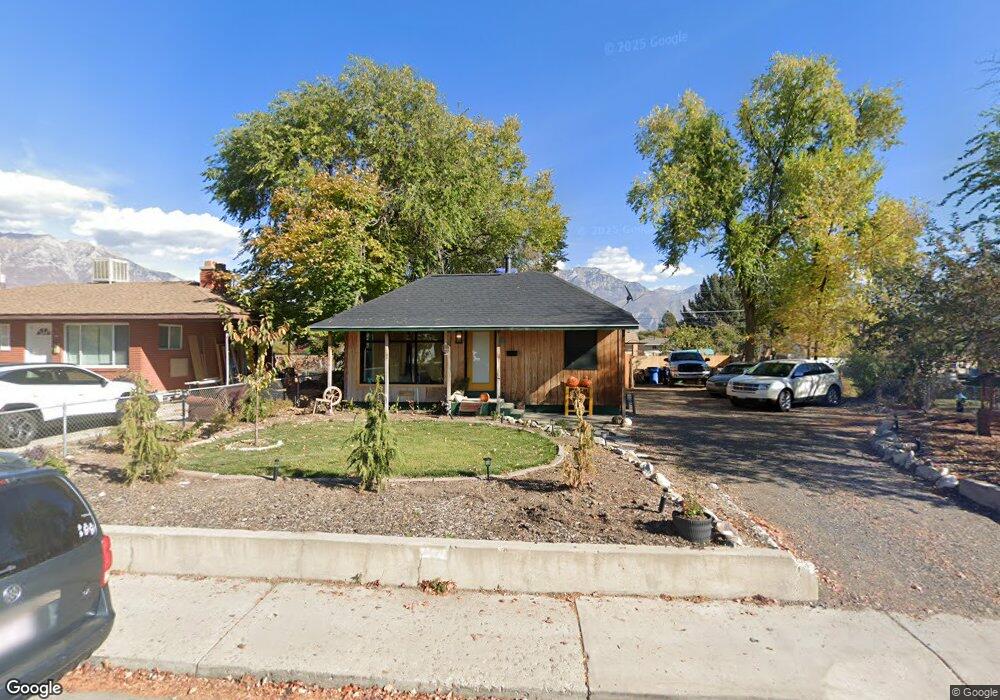
46 N 800 W Orem, UT 84057
Suncrest NeighborhoodEstimated Value: $387,202 - $449,000
3
Beds
1
Bath
1,102
Sq Ft
$377/Sq Ft
Est. Value
About This Home
This home is located at 46 N 800 W, Orem, UT 84057 and is currently estimated at $415,301, approximately $376 per square foot. 46 N 800 W is a home located in Utah County with nearby schools including Orem Junior High School, Mountain View High School, and Franklin Discovery Academy.
Ownership History
Date
Name
Owned For
Owner Type
Purchase Details
Closed on
Feb 9, 2018
Sold by
Cook Carolyn
Bought by
Ddrlc Cook Llc
Current Estimated Value
Purchase Details
Closed on
Nov 13, 2014
Sold by
Fenley Mary Dagmar and Constantinescu John
Bought by
Fenley John and Fenley Mary Dagmar
Home Financials for this Owner
Home Financials are based on the most recent Mortgage that was taken out on this home.
Original Mortgage
$64,000
Interest Rate
3.92%
Mortgage Type
Credit Line Revolving
Create a Home Valuation Report for This Property
The Home Valuation Report is an in-depth analysis detailing your home's value as well as a comparison with similar homes in the area
Home Values in the Area
Average Home Value in this Area
Purchase History
| Date | Buyer | Sale Price | Title Company |
|---|---|---|---|
| Ddrlc Cook Llc | -- | None Available | |
| Fenley John | -- | Meridian Title Co |
Source: Public Records
Mortgage History
| Date | Status | Borrower | Loan Amount |
|---|---|---|---|
| Closed | Fenley John | $64,000 |
Source: Public Records
Tax History
| Year | Tax Paid | Tax Assessment Tax Assessment Total Assessment is a certain percentage of the fair market value that is determined by local assessors to be the total taxable value of land and additions on the property. | Land | Improvement |
|---|---|---|---|---|
| 2025 | $1,389 | $190,245 | -- | -- |
| 2024 | $1,389 | $169,840 | $0 | $0 |
| 2023 | $1,256 | $165,055 | $0 | $0 |
| 2022 | $1,415 | $180,180 | $0 | $0 |
| 2021 | $1,241 | $239,400 | $111,400 | $128,000 |
| 2020 | $1,126 | $213,400 | $89,100 | $124,300 |
| 2019 | $1,001 | $197,200 | $89,100 | $108,100 |
| 2018 | $936 | $176,300 | $82,300 | $94,000 |
| 2017 | $857 | $86,405 | $0 | $0 |
| 2016 | $805 | $74,855 | $0 | $0 |
| 2015 | $798 | $70,235 | $0 | $0 |
| 2014 | $789 | $69,080 | $0 | $0 |
Source: Public Records
Map
Nearby Homes
- 896 W 30 S
- 45 N 970 W
- 565 W 40 N
- 508 W 40 N
- 162 N 450 W Unit 2
- 237 S Ridgeview Dr
- 155 S 1200 W Unit 69
- 155 S 1200 W Unit 6
- 155 S 1200 W Unit 97
- 222 N 1200 W Unit 144
- 222 N 1200 W Unit 53
- 222 N 1200 W Unit 84
- 62 N 380 W
- 489 N Beverly Ave
- 148 S 400 W
- 474 N Emery Ave
- 935 W 360 S
- 216 S 400 W
- 64 S 320 W
- 365 S 1015 W
Your Personal Tour Guide
Ask me questions while you tour the home.