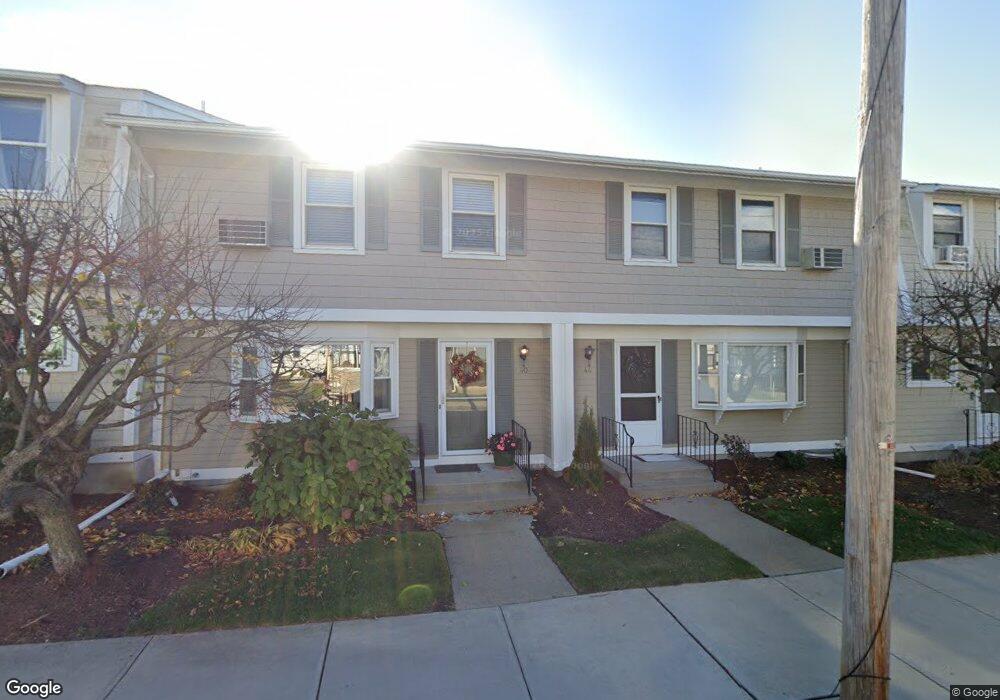
46 Newton St Pawtucket, RI 02860
Oak Hill NeighborhoodEstimated Value: $292,920 - $318,000
2
Beds
2
Baths
1,003
Sq Ft
$302/Sq Ft
Est. Value
About This Home
This home is located at 46 Newton St, Pawtucket, RI 02860 and is currently estimated at $303,230, approximately $302 per square foot. 46 Newton St is a home located in Providence County with nearby schools including International Charter School, Blackstone Academy Charter School, and Jewish Community Day School Of Rhode Island.
Ownership History
Date
Name
Owned For
Owner Type
Purchase Details
Closed on
Jun 18, 2025
Sold by
Wiredu Akua
Bought by
Lieberman Katie J and Lieberman Robert L
Current Estimated Value
Home Financials for this Owner
Home Financials are based on the most recent Mortgage that was taken out on this home.
Original Mortgage
$2,250,000
Outstanding Balance
$2,235,192
Interest Rate
6.38%
Mortgage Type
Purchase Money Mortgage
Estimated Equity
-$1,931,962
Purchase Details
Closed on
Jul 10, 1997
Sold by
Meister Elyse B
Bought by
Wiredu Akua
Home Financials for this Owner
Home Financials are based on the most recent Mortgage that was taken out on this home.
Original Mortgage
$52,000
Interest Rate
7.86%
Mortgage Type
Purchase Money Mortgage
Create a Home Valuation Report for This Property
The Home Valuation Report is an in-depth analysis detailing your home's value as well as a comparison with similar homes in the area
Home Values in the Area
Average Home Value in this Area
Purchase History
We collect this data history from publicly available records. To have your information removed, we recommend requesting removal directly through your county’s website.
| Date | Buyer | Sale Price | Title Company |
|---|---|---|---|
| Lieberman Katie J | $310,000 | None Available | |
| Lieberman Katie J | $310,000 | None Available | |
| Wiredu Akua | $65,000 | -- | |
| Wiredu Akua | $65,000 | -- |
Source: Public Records
Mortgage History
We collect this data history from publicly available records. To have your information removed, we recommend requesting removal directly through your county’s website.
| Date | Status | Borrower | Loan Amount |
|---|---|---|---|
| Open | Lieberman Katie J | $2,250,000 | |
| Closed | Lieberman Katie J | $2,250,000 | |
| Previous Owner | Wiredu Akua | $87,000 | |
| Previous Owner | Wiredu Akua | $30,000 | |
| Previous Owner | Wiredu Akua | $89,600 | |
| Previous Owner | Wiredu Akua | $52,000 |
Source: Public Records
Tax History
| Year | Tax Paid | Tax Assessment Tax Assessment Total Assessment is a certain percentage of the fair market value that is determined by local assessors to be the total taxable value of land and additions on the property. | Land | Improvement |
|---|---|---|---|---|
| 2025 | $2,965 | $225,500 | $0 | $225,500 |
| 2024 | $2,783 | $225,500 | $0 | $225,500 |
| 2023 | $2,714 | $160,200 | $0 | $160,200 |
| 2022 | $2,656 | $160,200 | $0 | $160,200 |
| 2021 | $2,656 | $160,200 | $0 | $160,200 |
| 2020 | $2,735 | $130,900 | $0 | $130,900 |
| 2019 | $2,735 | $130,900 | $0 | $130,900 |
| 2018 | $2,635 | $130,900 | $0 | $130,900 |
| 2017 | $2,242 | $98,700 | $0 | $98,700 |
| 2016 | $2,161 | $98,700 | $0 | $98,700 |
| 2015 | $2,161 | $98,700 | $0 | $98,700 |
| 2014 | $3,330 | $144,400 | $0 | $144,400 |
Source: Public Records
Map
Nearby Homes
- 103 Newton St
- 25 Blodgett Ave
- 64 Harvard St
- 133 Trenton St
- 32 Carver St
- 150 Ridge St
- 18 Dunnell Ave
- 5 Lowden St
- 80 Hillside Ave
- 14 Kimball Ave
- 268 Hillside Ave
- 6 Alfred Stone Rd
- 41 Campbell Terrace
- 40 Dryden Ave
- 135 Boutwell St
- 48 Waldo St
- 85 Blaisdell Ave
- 132 11th St
- 147 Warren Ave
- 76 Blaisdell Ave
Your Personal Tour Guide
Ask me questions while you tour the home.