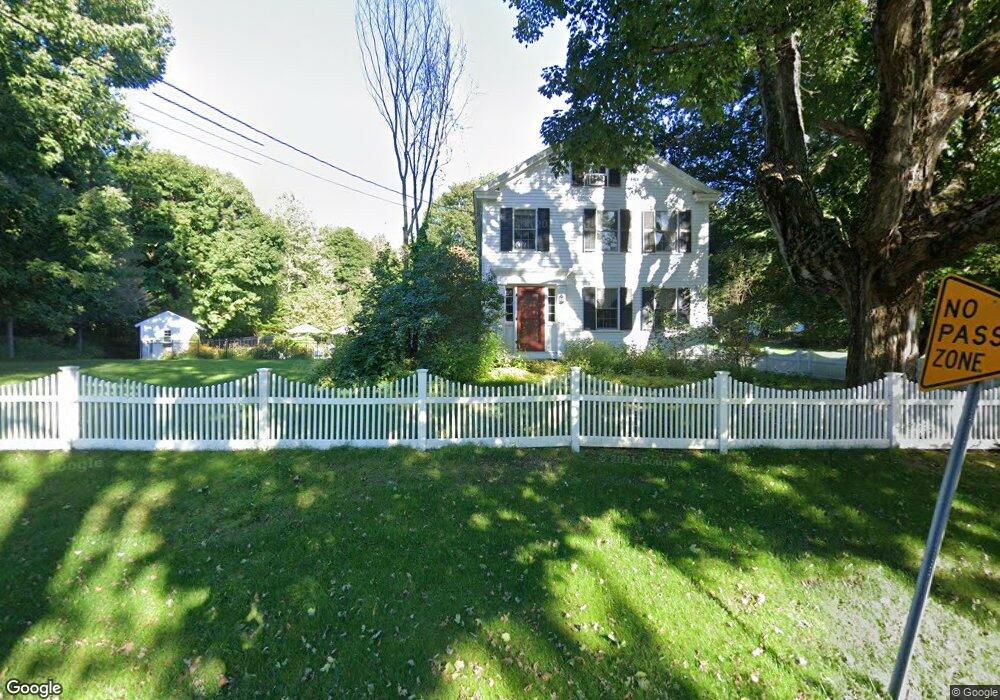
46 Richards Ave Paxton, MA 01612
Estimated Value: $837,000 - $855,408
4
Beds
4
Baths
4,336
Sq Ft
$195/Sq Ft
Est. Value
About This Home
This home is located at 46 Richards Ave, Paxton, MA 01612 and is currently estimated at $846,102, approximately $195 per square foot. 46 Richards Ave is a home located in Worcester County with nearby schools including Wachusett Regional High School and Holden Christian Academy.
Ownership History
Date
Name
Owned For
Owner Type
Purchase Details
Closed on
May 24, 2007
Sold by
Stimets Stacey A
Bought by
Witt Mark C and Witt Sheila M
Current Estimated Value
Purchase Details
Closed on
Feb 6, 2007
Sold by
Stimets Richard R and Stimets Stacey A
Bought by
Stimets Stacey A
Purchase Details
Closed on
Jul 28, 2006
Sold by
Stimets Richard R and Stimets Stacey
Bought by
Stimets Stacey
Purchase Details
Closed on
Jul 3, 1990
Sold by
Dillman Robert F
Bought by
Stimetss Richard R
Create a Home Valuation Report for This Property
The Home Valuation Report is an in-depth analysis detailing your home's value as well as a comparison with similar homes in the area
Home Values in the Area
Average Home Value in this Area
Purchase History
| Date | Buyer | Sale Price | Title Company |
|---|---|---|---|
| Witt Mark C | $545,000 | -- | |
| Stimets Stacey A | -- | -- | |
| Stimets Stacey | -- | -- | |
| Stimetss Richard R | $275,000 | -- |
Source: Public Records
Mortgage History
| Date | Status | Borrower | Loan Amount |
|---|---|---|---|
| Open | Stimetss Richard R | $363,000 | |
| Closed | Stimetss Richard R | $72,600 |
Source: Public Records
Tax History
| Year | Tax Paid | Tax Assessment Tax Assessment Total Assessment is a certain percentage of the fair market value that is determined by local assessors to be the total taxable value of land and additions on the property. | Land | Improvement |
|---|---|---|---|---|
| 2025 | $12,187 | $826,800 | $125,400 | $701,400 |
| 2024 | $11,227 | $698,600 | $125,400 | $573,200 |
| 2023 | $11,353 | $645,800 | $114,200 | $531,600 |
| 2022 | $10,802 | $569,100 | $114,200 | $454,900 |
| 2021 | $10,662 | $562,000 | $104,300 | $457,700 |
| 2020 | $10,905 | $552,700 | $95,000 | $457,700 |
| 2019 | $10,267 | $520,100 | $86,500 | $433,600 |
| 2018 | $9,085 | $444,700 | $95,400 | $349,300 |
| 2017 | $8,853 | $434,200 | $91,600 | $342,600 |
| 2016 | $8,567 | $416,100 | $87,700 | $328,400 |
| 2015 | $8,620 | $414,600 | $87,700 | $326,900 |
| 2014 | $8,358 | $407,500 | $88,000 | $319,500 |
Source: Public Records
Map
Nearby Homes
Your Personal Tour Guide
Ask me questions while you tour the home.