46 Riley Dr Riverside, RI 02915
Kent Heights NeighborhoodEstimated Value: $506,000 - $542,000
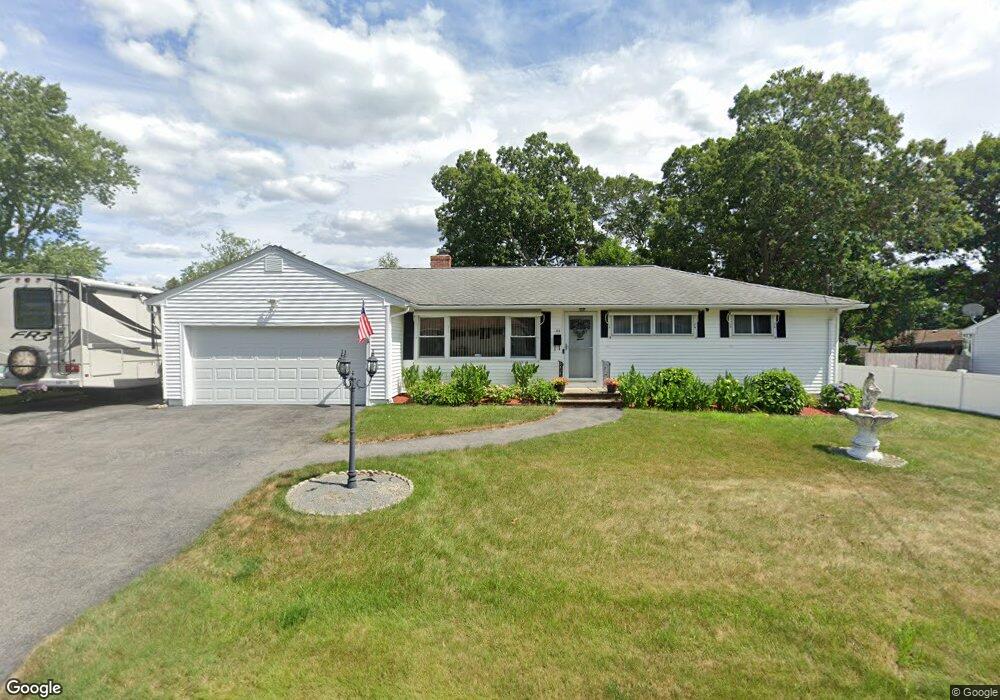
About This Home
This home is located at 46 Riley Dr, Riverside, RI 02915 and is currently estimated at $528,092, approximately $223 per square foot. 46 Riley Dr is a home located in Providence County with nearby schools including East Providence High School, The Gordon School, and St Mary Academy-Bay View.
Ownership History
We collect this data history from publicly available records. To have your information removed, we recommend requesting removal directly through your county’s website.
Purchase Details
Purchase Details
Home Values in the Area
Average Home Value in this Area
Purchase History
We collect this data history from publicly available records. To have your information removed, we recommend requesting removal directly through your county’s website.
| Date | Buyer | Sale Price | Title Company |
|---|---|---|---|
| -- | None Available | ||
| $150,000 | -- |
Mortgage History
We collect this data history from publicly available records. To have your information removed, we recommend requesting removal directly through your county’s website.
| Date | Status | Borrower | Loan Amount |
|---|---|---|---|
| Previous Owner | $129,209 | ||
| Previous Owner | $159,000 | ||
| Previous Owner | $180,800 | ||
| Previous Owner | $183,750 | ||
| Previous Owner | $108,000 | ||
| Previous Owner | $120,000 | ||
| Closed | $116,000 | ||
| Previous Owner | $122,000 |
Tax History
We collect this data history from publicly available records. To have your information removed, we recommend requesting removal directly through your county’s website.
| Year | Tax Paid | Tax Assessment Tax Assessment Total Assessment is a certain percentage of the fair market value that is determined by local assessors to be the total taxable value of land and additions on the property. | Land | Improvement |
|---|---|---|---|---|
| 2025 | $6,430 | $492,000 | $140,600 | $351,400 |
| 2024 | $6,126 | $399,600 | $117,300 | $282,300 |
| 2023 | $5,898 | $399,600 | $117,300 | $282,300 |
| 2022 | $5,579 | $255,200 | $63,100 | $192,100 |
| 2021 | $5,487 | $255,200 | $61,500 | $193,700 |
| 2020 | $5,255 | $255,200 | $61,500 | $193,700 |
| 2019 | $5,109 | $255,200 | $61,500 | $193,700 |
| 2018 | $5,180 | $226,400 | $63,100 | $163,300 |
| 2017 | $5,065 | $226,400 | $63,100 | $163,300 |
| 2016 | $5,040 | $226,400 | $63,100 | $163,300 |
| 2015 | $4,776 | $208,100 | $55,600 | $152,500 |
| 2014 | $4,776 | $208,100 | $55,600 | $152,500 |
Map
- 133 Wampanoag Trail
- 61 Ravena Ave
- 53 Wampanoag Trail
- 2919 Pawtucket Ave
- 2799 Pawtucket Ave
- 111 Wannamoisett Rd
- 336 Dover Ave
- 41 Wannamoisett Rd
- 105 Walmer Ave
- 16 Rachella Ct
- 123 Progress Ave
- 0 Robinson St
- 30 Ide Ave
- 123 Rice Ave
- 39 Fairview Ave
- 48 Jenks St
- 1402 S Broadway
- 680 Veterans Memorial Pkwy
- 28 Mayflower St
- 30 Dover Ave
Ask me questions while you tour the home.