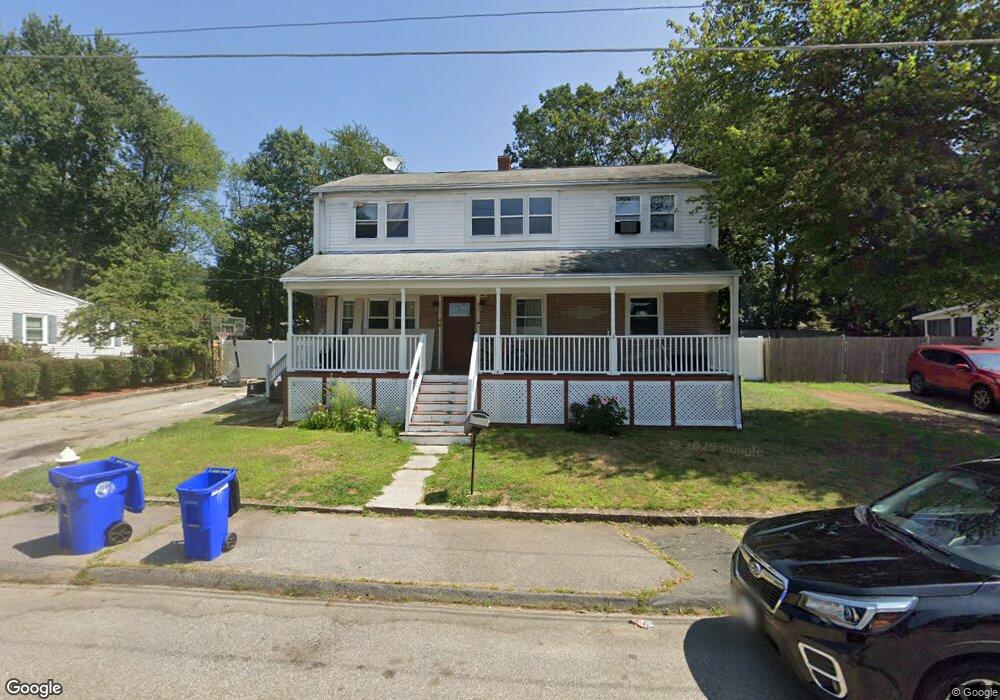
46 Rindone St Holbrook, MA 02343
Estimated Value: $548,000 - $593,000
6
Beds
2
Baths
2,260
Sq Ft
$254/Sq Ft
Est. Value
About This Home
This home is located at 46 Rindone St, Holbrook, MA 02343 and is currently estimated at $574,226, approximately $254 per square foot. 46 Rindone St is a home located in Norfolk County with nearby schools including John F. Kennedy Elementary School, Holbrook Middle High School, and Boston Higashi School.
Ownership History
Date
Name
Owned For
Owner Type
Purchase Details
Closed on
May 2, 2007
Sold by
Oliver Jean
Bought by
Compere Isabelle
Current Estimated Value
Home Financials for this Owner
Home Financials are based on the most recent Mortgage that was taken out on this home.
Original Mortgage
$251,200
Outstanding Balance
$153,297
Interest Rate
6.23%
Mortgage Type
Purchase Money Mortgage
Estimated Equity
$420,929
Create a Home Valuation Report for This Property
The Home Valuation Report is an in-depth analysis detailing your home's value as well as a comparison with similar homes in the area
Home Values in the Area
Average Home Value in this Area
Purchase History
We collect this data history from publicly available records. To have your information removed, we recommend requesting removal directly through your county’s website.
| Date | Buyer | Sale Price | Title Company |
|---|---|---|---|
| Compere Isabelle | $314,000 | -- | |
| Compere Isabelle | $314,000 | -- |
Source: Public Records
Mortgage History
We collect this data history from publicly available records. To have your information removed, we recommend requesting removal directly through your county’s website.
| Date | Status | Borrower | Loan Amount |
|---|---|---|---|
| Open | Compere Isabelle | $251,200 | |
| Closed | Compere Isabelle | $52,000 | |
| Closed | Compere Isabelle | $251,200 | |
| Previous Owner | Compere Isabelle | $116,800 | |
| Previous Owner | Compere Isabelle | $102,400 |
Source: Public Records
Tax History
| Year | Tax Paid | Tax Assessment Tax Assessment Total Assessment is a certain percentage of the fair market value that is determined by local assessors to be the total taxable value of land and additions on the property. | Land | Improvement |
|---|---|---|---|---|
| 2025 | $63 | $480,200 | $228,200 | $252,000 |
| 2024 | $6,332 | $471,100 | $223,200 | $247,900 |
| 2023 | $6,363 | $413,700 | $195,800 | $217,900 |
| 2022 | $6,268 | $380,100 | $186,500 | $193,600 |
| 2021 | $6,103 | $354,400 | $168,000 | $186,400 |
| 2020 | $6,398 | $348,300 | $166,200 | $182,100 |
| 2019 | $6,192 | $318,200 | $145,700 | $172,500 |
| 2018 | $6,265 | $303,100 | $134,900 | $168,200 |
| 2017 | $5,967 | $285,500 | $123,000 | $162,500 |
| 2016 | $5,387 | $274,300 | $116,100 | $158,200 |
| 2015 | $4,936 | $258,700 | $109,100 | $149,600 |
| 2014 | $4,749 | $253,000 | $109,100 | $143,900 |
Source: Public Records
Map
Nearby Homes
- 39 Marion St
- 38 Marion St
- 484 S Franklin St
- 30 Roseen Rd
- 610 S Franklin St Unit F101
- 35 Hillsdale Rd
- 27 Morgan Rd
- 627 S Franklin St
- 33 Quincy St
- 52 Quincy St
- 640 Plymouth St
- 4 Ell Rd
- 36 Kalmia Rd
- 43 Plymouth St
- 499 South St
- 45 Ernest St
- 299 N Quincy St Unit 1
- 299 N Quincy St Unit 2
- 14 Leonard Ln
- 167 Sycamore St
Your Personal Tour Guide
Ask me questions while you tour the home.