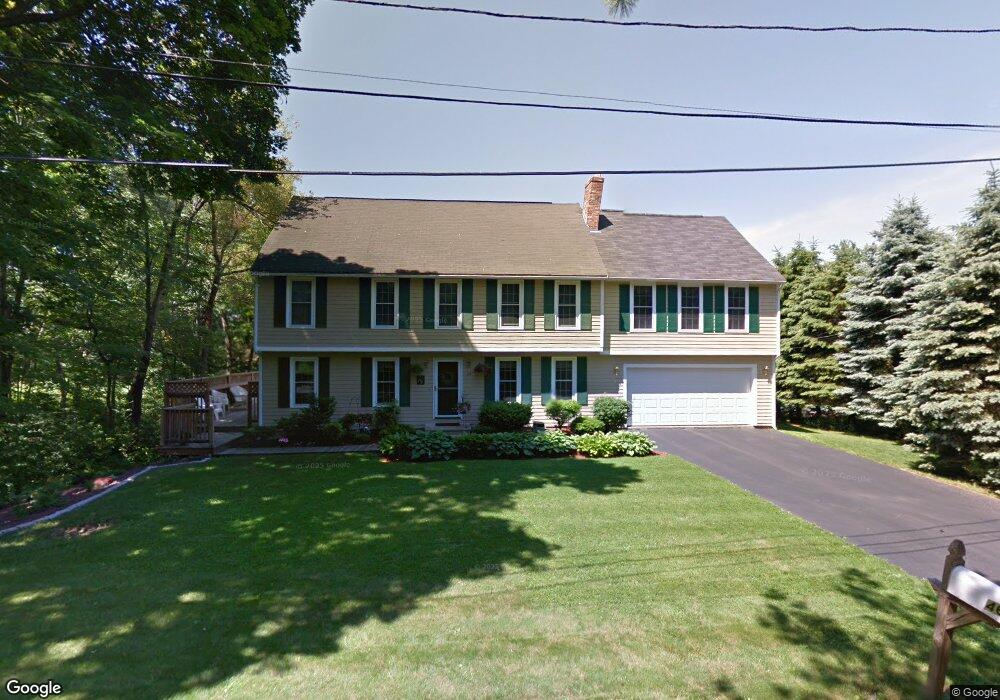
46 Summer St Methuen, MA 01844
Downtown Methuen NeighborhoodEstimated Value: $688,609 - $789,000
5
Beds
3
Baths
2,682
Sq Ft
$275/Sq Ft
Est. Value
About This Home
This home is located at 46 Summer St, Methuen, MA 01844 and is currently estimated at $737,902, approximately $275 per square foot. 46 Summer St is a home located in Essex County with nearby schools including Tenney Grammar School, Methuen High School, and Saint Monica School.
Ownership History
Date
Name
Owned For
Owner Type
Purchase Details
Closed on
Dec 17, 1987
Sold by
Ellco Inc
Bought by
Grange Douglas R
Current Estimated Value
Create a Home Valuation Report for This Property
The Home Valuation Report is an in-depth analysis detailing your home's value as well as a comparison with similar homes in the area
Home Values in the Area
Average Home Value in this Area
Purchase History
We collect this data history from publicly available records. To have your information removed, we recommend requesting removal directly through your county’s website.
| Date | Buyer | Sale Price | Title Company |
|---|---|---|---|
| Grange Douglas R | $194,900 | -- |
Source: Public Records
Mortgage History
We collect this data history from publicly available records. To have your information removed, we recommend requesting removal directly through your county’s website.
| Date | Status | Borrower | Loan Amount |
|---|---|---|---|
| Open | Grange Douglas R | $219,000 | |
| Closed | Grange Douglas R | $50,500 | |
| Closed | Grange Douglas R | $142,500 |
Source: Public Records
Tax History
| Year | Tax Paid | Tax Assessment Tax Assessment Total Assessment is a certain percentage of the fair market value that is determined by local assessors to be the total taxable value of land and additions on the property. | Land | Improvement |
|---|---|---|---|---|
| 2025 | $6,296 | $595,100 | $215,600 | $379,500 |
| 2024 | $6,291 | $579,300 | $196,600 | $382,700 |
| 2023 | $6,083 | $519,900 | $174,800 | $345,100 |
| 2022 | $5,780 | $442,900 | $145,700 | $297,200 |
| 2021 | $5,442 | $412,600 | $138,400 | $274,200 |
| 2020 | $5,391 | $401,100 | $138,400 | $262,700 |
| 2019 | $5,229 | $368,500 | $123,800 | $244,700 |
| 2018 | $5,094 | $357,000 | $123,800 | $233,200 |
| 2017 | $4,941 | $337,300 | $123,800 | $213,500 |
| 2016 | $4,828 | $326,000 | $116,500 | $209,500 |
| 2015 | $4,644 | $318,100 | $116,500 | $201,600 |
Source: Public Records
Map
Nearby Homes
- 15 Stillwater Rd
- 281 Broadway
- 98 Pleasant View St
- 115 Pleasant St
- 293 Jackson St
- 687 Jackson St
- 5 Pearl Ct
- 155-157 Tenney St
- 95 Pelham St Unit 3
- 80 Pond St Unit 1
- 31 Fairways Ln
- 99 Pond St
- 293 Lawrence Rd
- 3 Adams Ave
- 21 Hampshire Rd Unit 306
- 0 Hampshire Rd
- 13 Fairways Ln
- 23 Hampshire Rd Unit 112
- 45 Washington St Unit 90
- 4 Chelmsford St
Your Personal Tour Guide
Ask me questions while you tour the home.