460 Espy St Unit 5 Buford, GA 30518
Estimated Value: $690,000 - $762,977
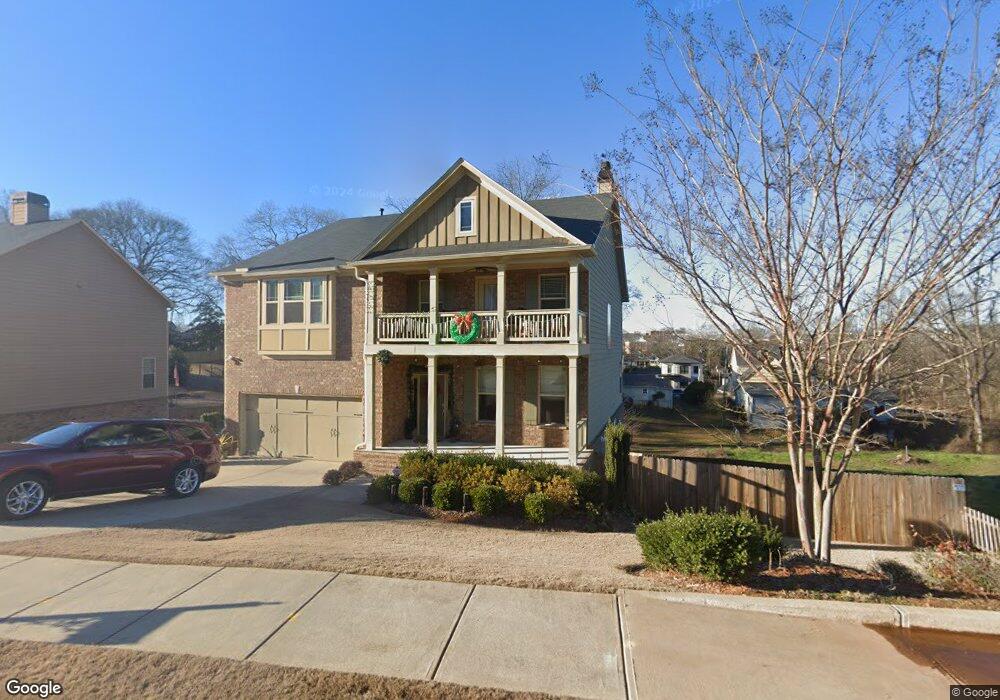
About This Home
This home is located at 460 Espy St Unit 5, Buford, GA 30518 and is currently estimated at $716,744, approximately $238 per square foot. 460 Espy St Unit 5 is a home located in Gwinnett County with nearby schools including Buford Elementary School, Buford Senior Academy, and Buford Academy.
Ownership History
We collect this data history from publicly available records. To have your information removed, we recommend requesting removal directly through your county’s website.
Purchase Details
Home Financials for this Owner
Home Financials are based on the most recent Mortgage that was taken out on this home.Purchase Details
Home Financials for this Owner
Home Financials are based on the most recent Mortgage that was taken out on this home.Purchase Details
Home Financials for this Owner
Home Financials are based on the most recent Mortgage that was taken out on this home.Purchase Details
Purchase Details
Home Values in the Area
Average Home Value in this Area
Purchase History
We collect this data history from publicly available records. To have your information removed, we recommend requesting removal directly through your county’s website.
| Date | Buyer | Sale Price | Title Company |
|---|---|---|---|
| $699,999 | -- | ||
| $645,000 | -- | ||
| $299,900 | -- | ||
| -- | -- | ||
| $96,000 | -- |
Mortgage History
We collect this data history from publicly available records. To have your information removed, we recommend requesting removal directly through your county’s website.
| Date | Status | Borrower | Loan Amount |
|---|---|---|---|
| Open | $674,973 | ||
| Previous Owner | $548,200 | ||
| Previous Owner | $239,200 |
Tax History
We collect this data history from publicly available records. To have your information removed, we recommend requesting removal directly through your county’s website.
| Year | Tax Paid | Tax Assessment Tax Assessment Total Assessment is a certain percentage of the fair market value that is determined by local assessors to be the total taxable value of land and additions on the property. | Land | Improvement |
|---|---|---|---|---|
| 2025 | $3,130 | $306,160 | $40,000 | $266,160 |
| 2024 | $3,130 | $227,920 | $26,000 | $201,920 |
| 2023 | $3,130 | $227,920 | $26,000 | $201,920 |
| 2022 | $1,599 | $266,640 | $26,000 | $240,640 |
| 2021 | $1,599 | $148,000 | $16,800 | $131,200 |
| 2020 | $155 | $148,000 | $16,800 | $131,200 |
| 2019 | $1,428 | $183,760 | $16,800 | $166,960 |
| 2018 | $1,428 | $119,960 | $8,800 | $111,160 |
| 2016 | $1,553 | $121,200 | $5,600 | $115,600 |
| 2015 | $66 | $5,000 | $5,000 | $0 |
| 2014 | $67 | $5,000 | $5,000 | $0 |
Map
- 440 S Alexander St
- 25 Sudderth St
- 585 Briard Dr
- 608 Church St
- 425 Church St
- 294 Watson St
- 29 E Park St
- 39 E Park St
- 169 W Park St
- 391 Pirkle Ave
- 553 S Hill St
- 1907 Sterling Chase
- 116 W Main St
- 1769 Rowland Pass
- 2051 Harvester Ln
- 1880 Grand Lanier Dr
- 480 Cooper Farm Way
- 1881 Grand Lanier Dr
- 59 Spring St
- 172 E Shadburn Ave
Ask me questions while you tour the home.