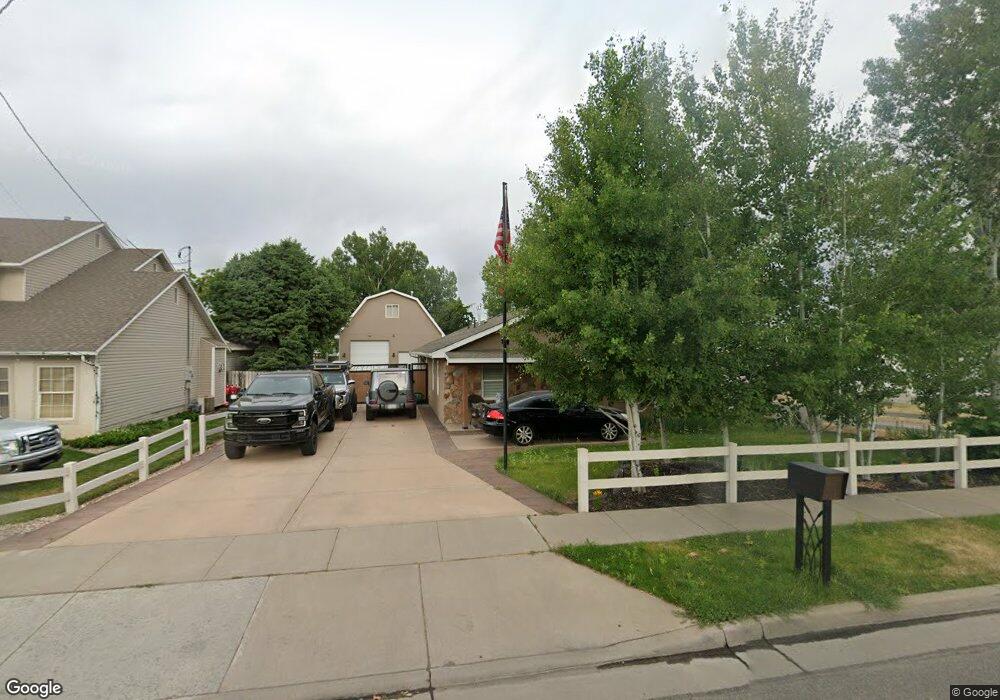
460 S 400 W Centerville, UT 84014
Estimated Value: $562,000 - $683,000
3
Beds
2
Baths
1,846
Sq Ft
$344/Sq Ft
Est. Value
About This Home
This home is located at 460 S 400 W, Centerville, UT 84014 and is currently estimated at $634,473, approximately $343 per square foot. 460 S 400 W is a home located in Davis County with nearby schools including J A Taylor Elementary School, Centerville Jr High, and Viewmont High School.
Ownership History
Date
Name
Owned For
Owner Type
Purchase Details
Closed on
Aug 23, 2023
Sold by
Keith And Lorraine Brown Joint Family Tr
Bought by
Rich Noah
Current Estimated Value
Home Financials for this Owner
Home Financials are based on the most recent Mortgage that was taken out on this home.
Original Mortgage
$340,000
Outstanding Balance
$332,466
Interest Rate
6.96%
Mortgage Type
Construction
Estimated Equity
$302,007
Purchase Details
Closed on
Nov 13, 2019
Sold by
Brown Lorraine S
Bought by
Brown Keith and Brown Lorraine S
Purchase Details
Closed on
Jan 8, 2014
Sold by
Brown Keith V
Bought by
Brown Lorraine S
Create a Home Valuation Report for This Property
The Home Valuation Report is an in-depth analysis detailing your home's value as well as a comparison with similar homes in the area
Purchase History
| Date | Buyer | Sale Price | Title Company |
|---|---|---|---|
| Rich Noah | -- | None Listed On Document | |
| Brown Keith | -- | None Available | |
| Brown Lorraine S | -- | None Available |
Source: Public Records
Mortgage History
| Date | Status | Borrower | Loan Amount |
|---|---|---|---|
| Open | Rich Noah | $340,000 |
Source: Public Records
Tax History
| Year | Tax Paid | Tax Assessment Tax Assessment Total Assessment is a certain percentage of the fair market value that is determined by local assessors to be the total taxable value of land and additions on the property. | Land | Improvement |
|---|---|---|---|---|
| 2025 | $3,318 | $317,350 | $181,053 | $136,297 |
| 2024 | $3,143 | $305,800 | $167,237 | $138,563 |
| 2023 | $2,509 | $441,000 | $268,398 | $172,602 |
| 2022 | $2,608 | $252,450 | $136,726 | $115,724 |
| 2021 | $2,427 | $366,000 | $215,473 | $150,527 |
| 2020 | $2,036 | $307,000 | $207,015 | $99,985 |
| 2019 | $2,112 | $311,000 | $196,309 | $114,691 |
| 2018 | $1,939 | $282,000 | $181,558 | $100,442 |
| 2016 | $1,676 | $135,520 | $62,169 | $73,351 |
| 2015 | $1,633 | $124,575 | $62,169 | $62,406 |
| 2014 | $1,578 | $123,155 | $62,169 | $60,986 |
| 2013 | -- | $105,110 | $47,209 | $57,901 |
Source: Public Records
Map
Nearby Homes
Your Personal Tour Guide
Ask me questions while you tour the home.