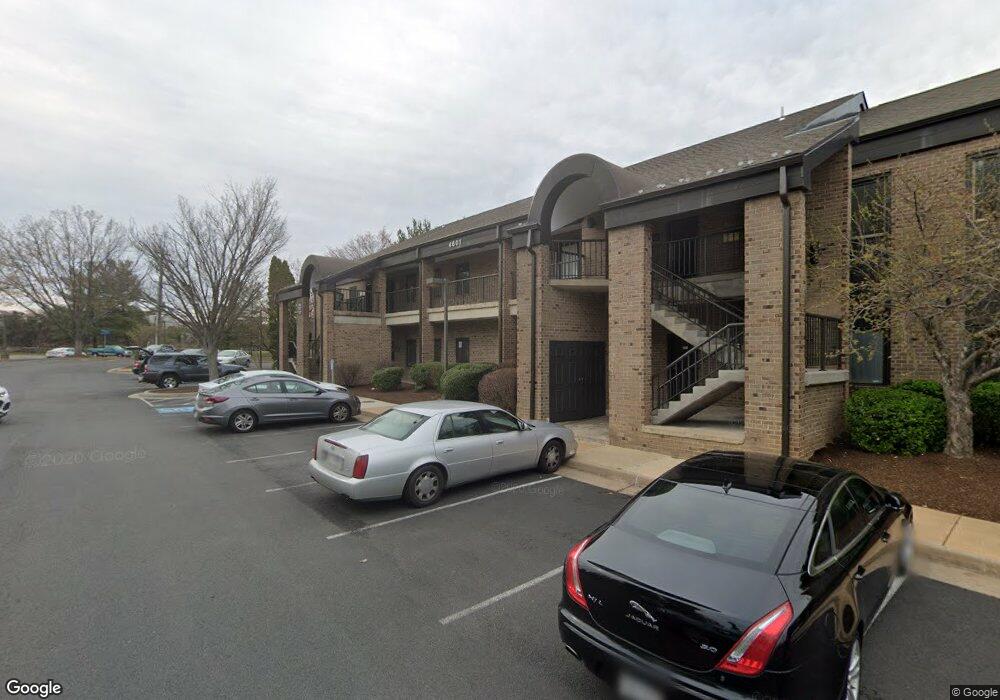
4601 Pinecrest Office Park Dr Unit E Alexandria, VA 22312
Estimated Value: $566,117
Studio
--
Bath
1,450
Sq Ft
$390/Sq Ft
Est. Value
About This Home
This home is located at 4601 Pinecrest Office Park Dr Unit E, Alexandria, VA 22312 and is currently estimated at $566,117, approximately $390 per square foot. 4601 Pinecrest Office Park Dr Unit E is a home located in Fairfax County with nearby schools including Columbia Elementary School, Holmes Middle School, and Annandale High School.
Ownership History
Date
Name
Owned For
Owner Type
Purchase Details
Closed on
Dec 7, 2021
Sold by
Christine A Chambers-Chun Trust
Bought by
Jong-Joon Chun Trust
Current Estimated Value
Purchase Details
Closed on
Feb 11, 2015
Sold by
Chun Jong Joon
Bought by
Chun Tr Jong Joon and Chambers Chun Tr Christine A
Purchase Details
Closed on
Oct 15, 2008
Sold by
Kang Poong C
Bought by
Chun And Chun Llc
Home Financials for this Owner
Home Financials are based on the most recent Mortgage that was taken out on this home.
Original Mortgage
$215,000
Interest Rate
6.41%
Mortgage Type
Commercial
Purchase Details
Closed on
Apr 3, 2001
Sold by
Mokhiber And Moretti Llc
Bought by
Kang Poong C
Home Financials for this Owner
Home Financials are based on the most recent Mortgage that was taken out on this home.
Original Mortgage
$120,000
Interest Rate
6.9%
Mortgage Type
Commercial
Create a Home Valuation Report for This Property
The Home Valuation Report is an in-depth analysis detailing your home's value as well as a comparison with similar homes in the area
Home Values in the Area
Average Home Value in this Area
Purchase History
| Date | Buyer | Sale Price | Title Company |
|---|---|---|---|
| Jong-Joon Chun Trust | -- | Hoffman Law | |
| Chun Tr Jong Joon | -- | -- | |
| Chun And Chun Llc | $315,000 | -- | |
| Kang Poong C | $155,000 | -- |
Source: Public Records
Mortgage History
| Date | Status | Borrower | Loan Amount |
|---|---|---|---|
| Previous Owner | Chun And Chun Llc | $215,000 | |
| Previous Owner | Kang Poong C | $120,000 |
Source: Public Records
Tax History
| Year | Tax Paid | Tax Assessment Tax Assessment Total Assessment is a certain percentage of the fair market value that is determined by local assessors to be the total taxable value of land and additions on the property. | Land | Improvement |
|---|---|---|---|---|
| 2025 | $3,690 | $287,520 | $57,500 | $230,020 |
| 2024 | $3,690 | $287,520 | $57,500 | $230,020 |
| 2023 | $2,928 | $233,610 | $46,720 | $186,890 |
| 2022 | $3,115 | $245,590 | $49,120 | $196,470 |
| 2021 | $3,033 | $233,610 | $46,720 | $186,890 |
| 2020 | $3,057 | $233,610 | $46,720 | $186,890 |
| 2019 | $3,057 | $233,610 | $46,720 | $186,890 |
| 2018 | $2,576 | $224,030 | $44,810 | $179,220 |
| 2017 | $3,158 | $245,590 | $49,120 | $196,470 |
| 2016 | $2,922 | $227,620 | $45,520 | $182,100 |
Source: Public Records
Map
Nearby Homes
- 4747 Valley St
- 6544 River Tweed Ln
- 6543 Tartan Vista Dr
- 6584 Irvin Ct
- 4816 Edwards St
- 6469 Second St
- 4534 Shoal Creek Ct
- 6409 Second St
- 4913 Grafton St
- 6587 Zoysia Ct
- 4609 Willow Run Dr
- 4214 Pine Ln
- 4147 Old Columbia Pike
- 6600 Reserves Hill Ct
- 4638 Linmar Ct
- 6640 Cardinal Ln
- 4555 Interlachen Ct Unit J
- 6392 Eighth Cir
- 4103 Century Ct
- 6332 Robert Todd Ct
- 4601 Pinecrest Office Park Dr Unit F
- 4601 Pinecrest Office Park Dr Unit G,H
- 4601 Pinecrest Office Park Dr Unit G
- 4601 Pinecrest Office Park Dr Unit A
- 4601 Pinecrest Office Park Dr Unit G AND H
- 4601 Pinecrest Office Park Dr Unit H
- 4601 Pinecrest Office Park Dr Unit D
- 4601E Pinecrest Office Park Dr Unit E
- 4601G Pinecrest Office Park Dr Unit G
- 4601G Pinecrest Office Park Dr Unit G,H
- 4601H Pinecrest Office Park Dr Unit H
- 4601 Pinecrest Office Park Dr
- 4601 G & H Pinecrest Office Park
- 4605 Pinecrest Office Park Dr Unit D
- 4605 Pinecrest Office Park Dr Unit G
- 4605 Pinecrest Office Park Dr
- 4605 Pinecrest Office Park Dr Unit H
- 4605E Pinecrest Office Park Dr
- 4604 Pinecrest Office Park Dr Unit E
- 4604 Pinecrest Office Park Dr Unit F
Your Personal Tour Guide
Ask me questions while you tour the home.