4611 Tara Dr Fairfax, VA 22032
Estimated Value: $750,000 - $885,000
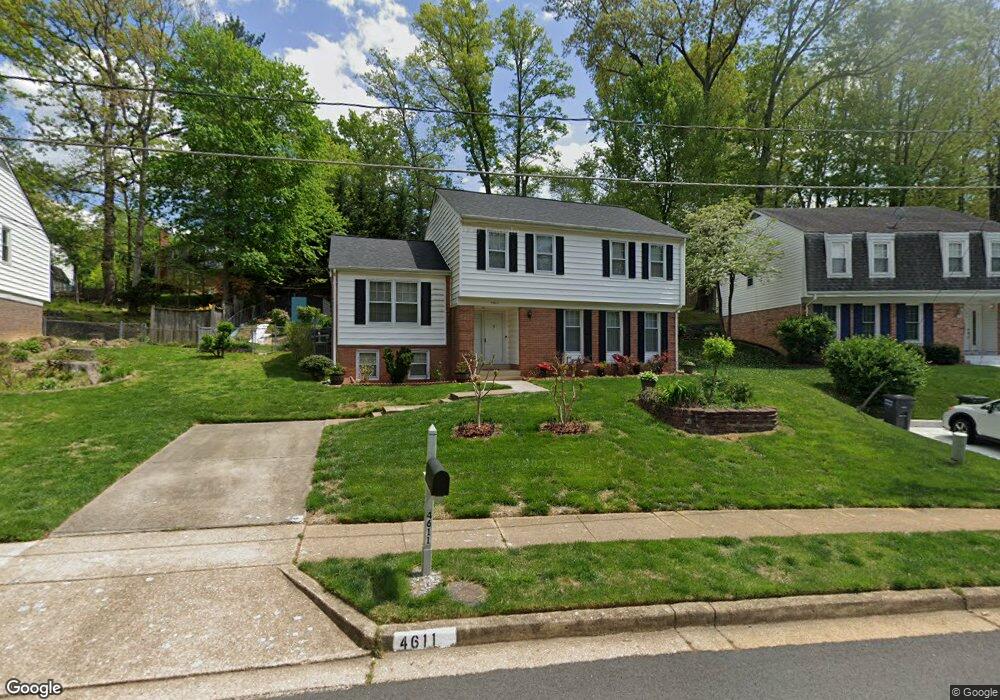
About This Home
This home is located at 4611 Tara Dr, Fairfax, VA 22032 and is currently estimated at $818,215, approximately $388 per square foot. 4611 Tara Dr is a home located in Fairfax County with nearby schools including Olde Creek Elementary School, Frost Middle School, and W. T. Woodson High School.
Ownership History
We collect this data history from publicly available records. To have your information removed, we recommend requesting removal directly through your county’s website.
Purchase Details
Home Financials for this Owner
Home Financials are based on the most recent Mortgage that was taken out on this home.Home Values in the Area
Average Home Value in this Area
Purchase History
We collect this data history from publicly available records. To have your information removed, we recommend requesting removal directly through your county’s website.
| Date | Buyer | Sale Price | Title Company |
|---|---|---|---|
| $505,000 | -- |
Mortgage History
We collect this data history from publicly available records. To have your information removed, we recommend requesting removal directly through your county’s website.
| Date | Status | Borrower | Loan Amount |
|---|---|---|---|
| Open | $404,000 |
Tax History
We collect this data history from publicly available records. To have your information removed, we recommend requesting removal directly through your county’s website.
| Year | Tax Paid | Tax Assessment Tax Assessment Total Assessment is a certain percentage of the fair market value that is determined by local assessors to be the total taxable value of land and additions on the property. | Land | Improvement |
|---|---|---|---|---|
| 2025 | $7,855 | $711,840 | $330,000 | $381,840 |
| 2024 | $7,855 | $678,060 | $300,000 | $378,060 |
| 2023 | $7,415 | $657,050 | $290,000 | $367,050 |
| 2022 | $7,047 | $616,270 | $270,000 | $346,270 |
| 2021 | $6,782 | $577,950 | $245,000 | $332,950 |
| 2020 | $6,346 | $536,170 | $225,000 | $311,170 |
| 2019 | $6,096 | $515,070 | $210,000 | $305,070 |
| 2018 | $5,756 | $500,540 | $210,000 | $290,540 |
| 2017 | $5,811 | $500,540 | $210,000 | $290,540 |
| 2016 | $5,669 | $489,370 | $210,000 | $279,370 |
| 2015 | $5,333 | $477,890 | $204,000 | $273,890 |
| 2014 | $4,984 | $447,600 | $194,000 | $253,600 |
Map
- 4900 Mcfarland Dr
- 4655 Braddock Green Ct
- 9201 Bayard Place
- 5002 Mcfarland Dr
- 5039 Head Ct
- 4618 Guinea Rd
- 9361 Tartan View Dr
- 9303 Burnetta Dr
- 9341 Chestnut Knolls Dr
- 9519 Heathwood Ct
- 4915 Powell Rd
- 9340 Chestnut Knolls Dr
- 9318 Humphries Dr
- 4819 Tabard Place
- 9804 Dansk Ct
- 4410 Guinea Rd
- 9307 Shari Dr
- 4604 Willet Dr
- 5105 Walport Ln
- 9023 Windflower Ln
Ask me questions while you tour the home.