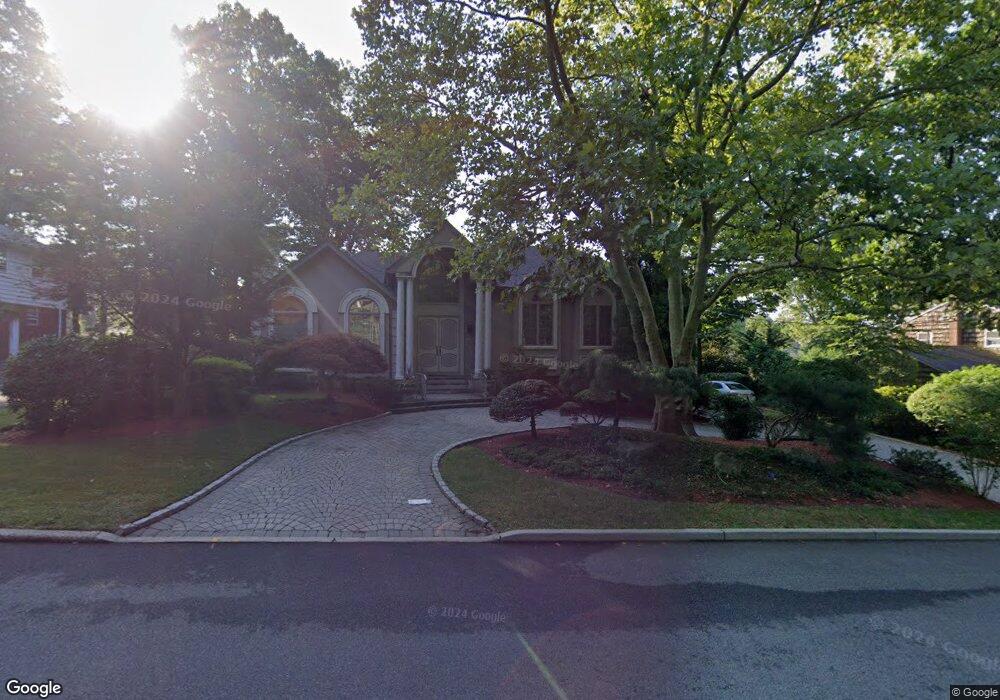
463 Summit St Englewood Cliffs, NJ 07632
Estimated Value: $1,675,000 - $2,436,000
Studio
--
Bath
4,067
Sq Ft
$465/Sq Ft
Est. Value
About This Home
This home is located at 463 Summit St, Englewood Cliffs, NJ 07632 and is currently estimated at $1,890,867, approximately $464 per square foot. 463 Summit St is a home located in Bergen County with nearby schools including North Cliff Elementary School, Upper School Elementary School, and Englewood on the Palisades Charter School.
Ownership History
Date
Name
Owned For
Owner Type
Purchase Details
Closed on
Aug 19, 2019
Sold by
Najarian Mary Est
Bought by
Mary Najarian Ft
Current Estimated Value
Purchase Details
Closed on
Aug 6, 2015
Sold by
Najarian Lawrence V
Bought by
Najarian Lawrence V and Mary Najarian Qualified Terminable Inter
Purchase Details
Closed on
Feb 25, 2005
Purchase Details
Closed on
Nov 15, 2001
Sold by
Najarian Vahan
Bought by
Najarian Mary
Create a Home Valuation Report for This Property
The Home Valuation Report is an in-depth analysis detailing your home's value as well as a comparison with similar homes in the area
Home Values in the Area
Average Home Value in this Area
Purchase History
| Date | Buyer | Sale Price | Title Company |
|---|---|---|---|
| Mary Najarian Ft | -- | -- | |
| Najarian Lawrence V | -- | Attorney | |
| -- | -- | -- | |
| Najarian Mary | $760,000 | -- |
Source: Public Records
Tax History
| Year | Tax Paid | Tax Assessment Tax Assessment Total Assessment is a certain percentage of the fair market value that is determined by local assessors to be the total taxable value of land and additions on the property. | Land | Improvement |
|---|---|---|---|---|
| 2025 | $14,433 | $1,249,600 | $697,500 | $552,100 |
| 2024 | $14,258 | $1,249,600 | $697,500 | $552,100 |
| 2023 | $14,033 | $1,249,600 | $697,500 | $552,100 |
| 2022 | $14,033 | $1,249,600 | $697,500 | $552,100 |
| 2021 | $10,788 | $1,249,600 | $697,500 | $552,100 |
| 2020 | $14,383 | $1,249,600 | $697,500 | $552,100 |
| 2019 | $13,508 | $1,249,600 | $697,500 | $552,100 |
| 2018 | $13,033 | $1,249,600 | $697,500 | $552,100 |
| 2017 | $12,471 | $1,249,600 | $697,500 | $552,100 |
| 2016 | $12,234 | $1,249,600 | $697,500 | $552,100 |
| 2015 | $11,371 | $1,249,600 | $697,500 | $552,100 |
| 2014 | $10,622 | $1,249,600 | $697,500 | $552,100 |
Source: Public Records
Map
Nearby Homes
Your Personal Tour Guide
Ask me questions while you tour the home.