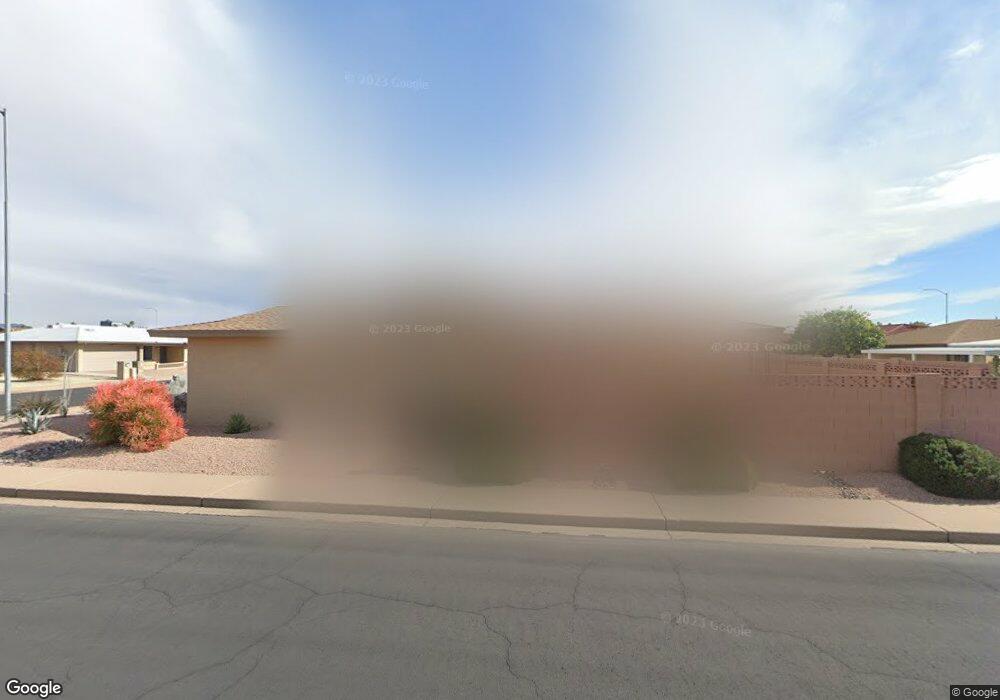
4631 E Carol Ave Mesa, AZ 85206
Sunland Village NeighborhoodEstimated Value: $364,278 - $428,000
Studio
2
Baths
2,152
Sq Ft
$185/Sq Ft
Est. Value
About This Home
This home is located at 4631 E Carol Ave, Mesa, AZ 85206 and is currently estimated at $397,570, approximately $184 per square foot. 4631 E Carol Ave is a home located in Maricopa County with nearby schools including Franklin at Brimhall Elementary School, Madison Elementary School, and Franklin West Elementary School.
Ownership History
Date
Name
Owned For
Owner Type
Purchase Details
Closed on
Mar 13, 2016
Sold by
Walczak Paul D and Walczak Monica L
Bought by
Walczak Paul D and Walczak Monica L
Current Estimated Value
Purchase Details
Closed on
Jan 7, 2014
Sold by
Nygaard Joan M
Bought by
Walczak Paul D and Walczak Monica L
Home Financials for this Owner
Home Financials are based on the most recent Mortgage that was taken out on this home.
Original Mortgage
$168,000
Outstanding Balance
$127,171
Interest Rate
4.46%
Mortgage Type
Seller Take Back
Estimated Equity
$270,399
Purchase Details
Closed on
Jan 27, 1998
Sold by
Lloyd Helen C and Hawkins Marian C
Bought by
Nygaard Marvin E and Nygaard Joan M
Home Financials for this Owner
Home Financials are based on the most recent Mortgage that was taken out on this home.
Original Mortgage
$102,800
Interest Rate
6.9%
Mortgage Type
New Conventional
Create a Home Valuation Report for This Property
The Home Valuation Report is an in-depth analysis detailing your home's value as well as a comparison with similar homes in the area
Home Values in the Area
Average Home Value in this Area
Purchase History
| Date | Buyer | Sale Price | Title Company |
|---|---|---|---|
| Walczak Paul D | -- | None Available | |
| Walczak Paul D | $178,000 | Stewart Title & Trust Of Pho | |
| Nygaard Marvin E | $128,500 | Transnation Title Insurance |
Source: Public Records
Mortgage History
| Date | Status | Borrower | Loan Amount |
|---|---|---|---|
| Open | Walczak Paul D | $168,000 | |
| Previous Owner | Nygaard Marvin E | $102,800 |
Source: Public Records
Tax History
| Year | Tax Paid | Tax Assessment Tax Assessment Total Assessment is a certain percentage of the fair market value that is determined by local assessors to be the total taxable value of land and additions on the property. | Land | Improvement |
|---|---|---|---|---|
| 2025 | $1,872 | $22,144 | -- | -- |
| 2024 | $2,221 | $21,089 | -- | -- |
| 2023 | $2,221 | $29,450 | $5,890 | $23,560 |
| 2022 | $2,176 | $24,200 | $4,840 | $19,360 |
| 2021 | $2,197 | $20,500 | $4,100 | $16,400 |
| 2020 | $2,168 | $19,970 | $3,990 | $15,980 |
| 2019 | $2,027 | $18,750 | $3,750 | $15,000 |
| 2018 | $1,944 | $17,770 | $3,550 | $14,220 |
| 2017 | $1,887 | $16,850 | $3,370 | $13,480 |
| 2016 | $1,564 | $16,650 | $3,330 | $13,320 |
| 2015 | $1,482 | $15,300 | $3,060 | $12,240 |
Source: Public Records
Map
Nearby Homes
- 4620 E Dragoon Ave
- 4706 E Capri Ave
- 4604 E Crescent Ave
- 515 S Parkcrest Unit 532
- 425 S Parkcrest Unit 343
- 425 S Parkcrest Unit 322
- 4655 E Delta Ave
- 418 S Roanoke
- 4502 E Carol Ave Unit 1
- 440 S Parkcrest Unit 138
- 440 S Parkcrest Unit 145
- 4927 E Crescent Ave
- 829 S Roanoke
- 4363 E Dragoon Cir
- 730 S Portland
- 4327 E Catalina Cir
- 423 S Racine
- 4735 E Elena Ave
- 542 S Higley Rd Unit 61
- 542 S Higley Rd Unit 54
- 4641 E Carol Ave
- 4626 E Carmel Ave
- 4634 E Carmel Ave
- 4608 E Carol Ave
- 4632 E Carol Ave
- 4649 E Carol Ave
- 4602 E Carol Ave
- 4618 E Carol Ave
- 4642 E Carmel Ave
- 4624 E Carol Ave
- 4650 E Carol Ave
- 4653 E Carol Ave
- 4625 E Carmel Ave
- 4633 E Capri Ave
- 539 S Quinn
- 4652 E Carmel Ave
- 4633 E Carmel Ave
- 4633 E Carmel Ave
- 529 S Quinn
- 4617 E Carmel Ave
Your Personal Tour Guide
Ask me questions while you tour the home.