465 10th St Plainwell, MI 49080
Estimated Value: $253,000 - $262,000
About This Home
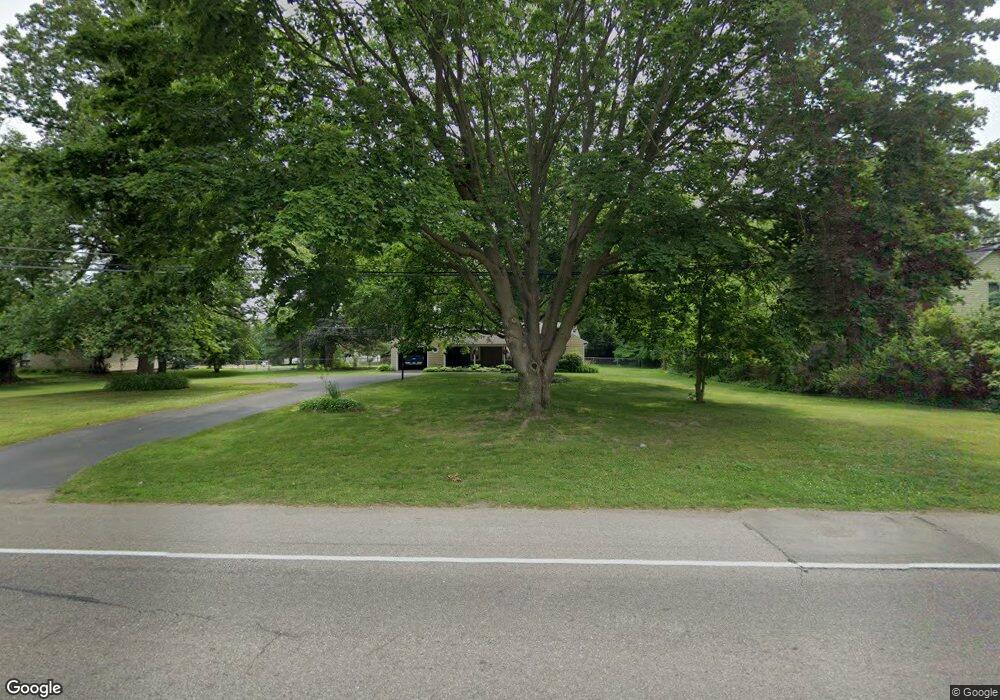
This home is located at 465 10th St, Plainwell, MI 49080 and is currently estimated at $257,731, approximately $176 per square foot. 465 10th St is a home located in Allegan County with nearby schools including Plainwell High School and Otsego Christian Academy.
Ownership History
We collect this data history from publicly available records. To have your information removed, we recommend requesting removal directly through your county’s website.
Purchase Details
Purchase Details
Purchase Details
Purchase Details
Home Financials for this Owner
Home Financials are based on the most recent Mortgage that was taken out on this home.Home Values in the Area
Average Home Value in this Area
Purchase History
We collect this data history from publicly available records. To have your information removed, we recommend requesting removal directly through your county’s website.
| Date | Buyer | Sale Price | Title Company |
|---|---|---|---|
| $63,000 | None Available | ||
| -- | None Available | ||
| $89,587 | None Available | ||
| $98,000 | Chicago Title |
Mortgage History
We collect this data history from publicly available records. To have your information removed, we recommend requesting removal directly through your county’s website.
| Date | Status | Borrower | Loan Amount |
|---|---|---|---|
| Previous Owner | $97,028 |
Tax History
We collect this data history from publicly available records. To have your information removed, we recommend requesting removal directly through your county’s website.
| Year | Tax Paid | Tax Assessment Tax Assessment Total Assessment is a certain percentage of the fair market value that is determined by local assessors to be the total taxable value of land and additions on the property. | Land | Improvement |
|---|---|---|---|---|
| 2026 | $3,789 | $119,800 | $44,200 | $75,600 |
| 2025 | $3,696 | $113,800 | $42,500 | $71,300 |
| 2024 | $3,344 | $104,300 | $38,600 | $65,700 |
| 2023 | $3,368 | $93,200 | $35,800 | $57,400 |
| 2022 | $3,344 | $89,400 | $35,200 | $54,200 |
| 2021 | $3,219 | $82,000 | $32,300 | $49,700 |
| 2020 | $3,177 | $72,100 | $26,300 | $45,800 |
| 2019 | $2,946 | $67,800 | $25,000 | $42,800 |
| 2018 | $0 | $59,500 | $21,600 | $37,900 |
| 2017 | $0 | $57,600 | $21,100 | $36,500 |
| 2016 | $0 | $46,100 | $11,100 | $35,000 |
| 2015 | -- | $46,100 | $11,100 | $35,000 |
| 2014 | -- | $44,200 | $11,700 | $32,500 |
| 2013 | -- | $44,000 | $13,600 | $30,400 |
Map
- 501 E Stoneridge Dr
- 111 Prospect Ave
- 143 Floral Ave
- 108 S Main St
- 127 W Bridge St
- 426 W Bridge St
- V/L 10th St
- 830 Miller Rd Unit 26.98 Acres
- 220 S Anderson St
- 221 S Woodhams St
- 721 E Bridge St
- 676 N 10th St
- 355 12th St
- 919 Charles St
- 1050 102nd Ave
- 1049 Bloomfield Ave
- 1047 Bronson Ave
- V/L Bronson Ave
- 726 Sycamore Bend
- 1255 106th Ave
Ask me questions while you tour the home.