465 Chestnut St Uxbridge, MA 01569
Estimated Value: $622,000 - $693,000
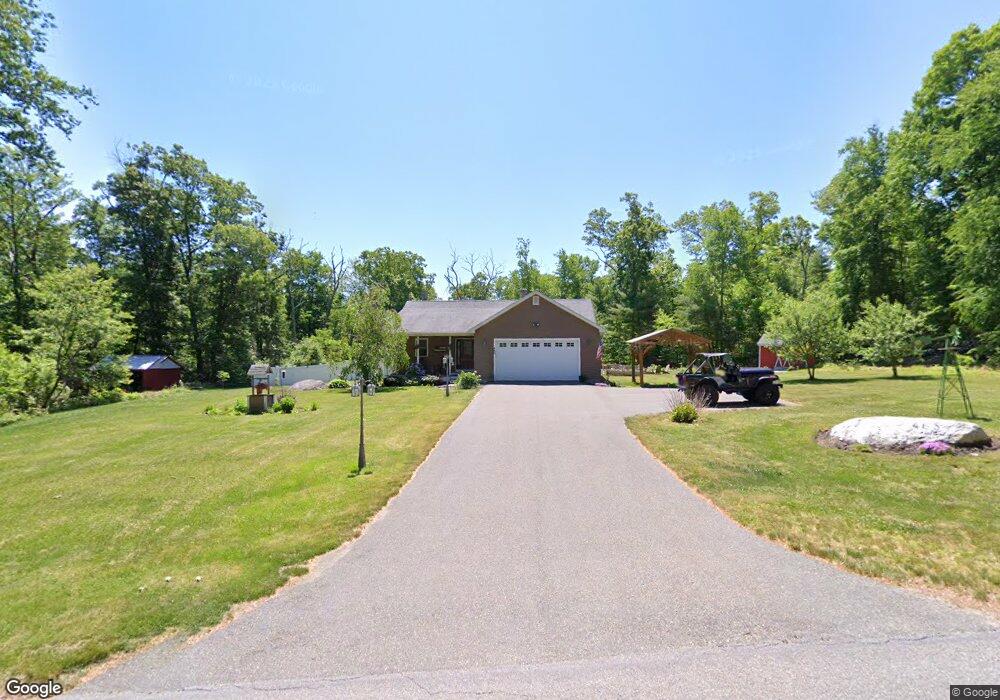
About This Home
This home is located at 465 Chestnut St, Uxbridge, MA 01569 and is currently estimated at $655,408, approximately $343 per square foot. 465 Chestnut St is a home with nearby schools including Uxbridge High School.
Ownership History
We collect this data history from publicly available records. To have your information removed, we recommend requesting removal directly through your county’s website.
Purchase Details
Home Financials for this Owner
Home Financials are based on the most recent Mortgage that was taken out on this home.Purchase Details
Home Values in the Area
Average Home Value in this Area
Purchase History
We collect this data history from publicly available records. To have your information removed, we recommend requesting removal directly through your county’s website.
| Date | Buyer | Sale Price | Title Company |
|---|---|---|---|
| -- | -- | ||
| -- | -- |
Mortgage History
We collect this data history from publicly available records. To have your information removed, we recommend requesting removal directly through your county’s website.
| Date | Status | Borrower | Loan Amount |
|---|---|---|---|
| Open | $249,500 | ||
| Closed | $249,500 |
Tax History
We collect this data history from publicly available records. To have your information removed, we recommend requesting removal directly through your county’s website.
| Year | Tax Paid | Tax Assessment Tax Assessment Total Assessment is a certain percentage of the fair market value that is determined by local assessors to be the total taxable value of land and additions on the property. | Land | Improvement |
|---|---|---|---|---|
| 2025 | $83 | $634,300 | $170,500 | $463,800 |
| 2024 | $7,547 | $584,100 | $161,800 | $422,300 |
| 2023 | $6,875 | $492,800 | $139,900 | $352,900 |
| 2022 | $6,678 | $440,500 | $122,400 | $318,100 |
| 2021 | $6,928 | $437,900 | $119,800 | $318,100 |
| 2020 | $7,011 | $418,800 | $118,000 | $300,800 |
| 2019 | $7,162 | $412,800 | $118,000 | $294,800 |
| 2018 | $6,672 | $388,600 | $118,000 | $270,600 |
| 2017 | $6,411 | $378,000 | $108,200 | $269,800 |
| 2016 | $7,037 | $400,500 | $102,900 | $297,600 |
| 2015 | $6,769 | $389,000 | $102,900 | $286,100 |
Map
- 342 Chestnut St
- 385 River Rd
- 424 Buxton St
- 203 Albee Rd
- 111 Cider Mill Rd
- 56 King St
- 7 Tabor Rd
- 20 Turner Farm Rd
- 107 B Providence St Unit A
- 33 Avery Ln
- 26 Avery Ln
- 0 Avery Ln Unit 1408492
- 24 Avery Ln
- 0 Avery Ln Unit 1410899
- Lot 43 Turner Farm Rd
- 60 Forest View Dr
- 61 Grove
- 0 Buxton St Unit 1386233
- 8 Old Coach Rd
- 1003 Victory Hwy
- 435 Chestnut St
- 430 Chestnut St
- 419 Chestnut St
- 416 Chestnut St
- 282 Elmwood Ave
- 11 Erickson St
- 298 Elmwood Ave
- 382 Chestnut St
- 396 Chestnut St
- 385 Chestnut St
- 310 Elmwood Ave
- 5 South St
- 30 Erickson St
- 374 Chestnut St
- 16 Colonel Dr
- 379 Chestnut St
- 328 Elmwood Ave
- 328 Elmwood Ave
- 328 Elmwood Ave Unit A
- 359 Elmwood Ave
Ask me questions while you tour the home.