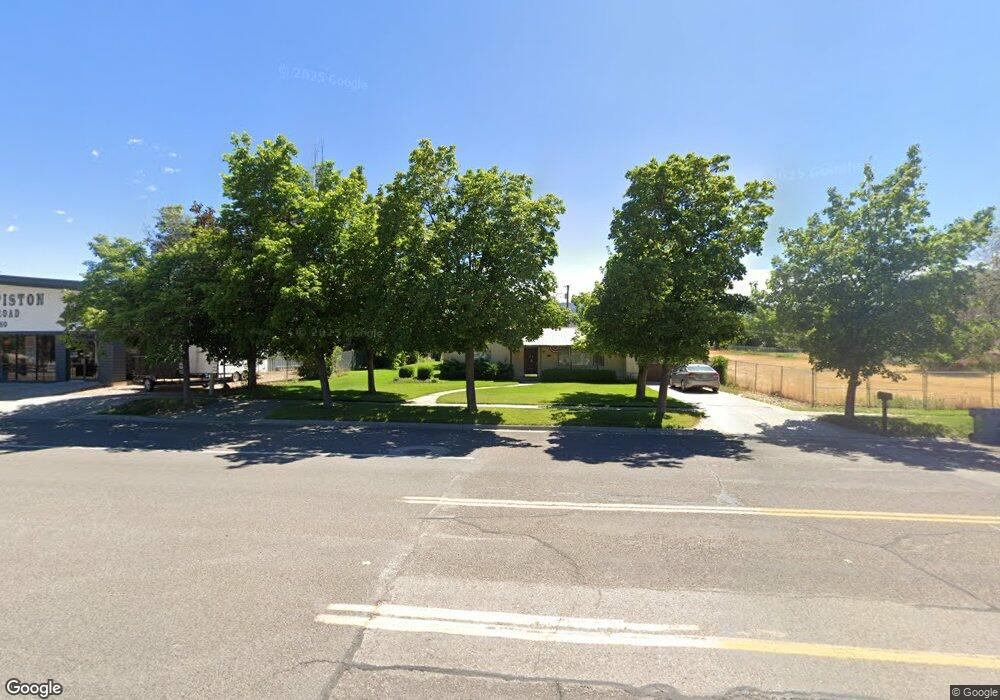
465 S Main St Fillmore, UT 84631
Estimated Value: $315,000 - $423,000
3
Beds
3
Baths
2,104
Sq Ft
$179/Sq Ft
Est. Value
About This Home
This home is located at 465 S Main St, Fillmore, UT 84631 and is currently estimated at $377,280, approximately $179 per square foot. 465 S Main St is a home located in Millard County.
Ownership History
Date
Name
Owned For
Owner Type
Purchase Details
Closed on
Jun 1, 2023
Sold by
Martin Family Trust
Bought by
Christensen Max C and Christensen Linda R
Current Estimated Value
Home Financials for this Owner
Home Financials are based on the most recent Mortgage that was taken out on this home.
Original Mortgage
$308,750
Outstanding Balance
$299,834
Interest Rate
6.39%
Mortgage Type
New Conventional
Estimated Equity
$77,446
Create a Home Valuation Report for This Property
The Home Valuation Report is an in-depth analysis detailing your home's value as well as a comparison with similar homes in the area
Home Values in the Area
Average Home Value in this Area
Purchase History
We collect this data history from publicly available records. To have your information removed, we recommend requesting removal directly through your county’s website.
| Date | Buyer | Sale Price | Title Company |
|---|---|---|---|
| Christensen Max C | -- | First American Title Insurance |
Source: Public Records
Mortgage History
We collect this data history from publicly available records. To have your information removed, we recommend requesting removal directly through your county’s website.
| Date | Status | Borrower | Loan Amount |
|---|---|---|---|
| Open | Christensen Max C | $308,750 |
Source: Public Records
Tax History
| Year | Tax Paid | Tax Assessment Tax Assessment Total Assessment is a certain percentage of the fair market value that is determined by local assessors to be the total taxable value of land and additions on the property. | Land | Improvement |
|---|---|---|---|---|
| 2025 | $1,535 | $192,757 | $33,086 | $159,671 |
| 2024 | $1,535 | $174,018 | $25,596 | $148,422 |
| 2023 | $1,847 | $174,018 | $25,596 | $148,422 |
| 2022 | $1,346 | $120,854 | $23,269 | $97,585 |
| 2021 | $1,172 | $101,078 | $15,110 | $85,968 |
| 2020 | $1,085 | $94,128 | $13,736 | $80,392 |
| 2019 | $928 | $80,681 | $13,736 | $66,945 |
| 2018 | $878 | $78,177 | $13,736 | $64,441 |
| 2017 | $765 | $64,772 | $12,499 | $52,273 |
| 2016 | $732 | $64,772 | $12,499 | $52,273 |
| 2015 | $732 | $64,772 | $12,499 | $52,273 |
| 2014 | -- | $64,772 | $12,499 | $52,273 |
| 2013 | -- | $64,772 | $12,499 | $52,273 |
Source: Public Records
Map
Nearby Homes
- 465 S 100 W
- 155 E 500 St S
- 157 E 500 South St
- 250 S Main St
- 250 E 500 South St
- 220 S 200 E
- 405 E 500 St S
- 260 W 200 S
- 40 S 100 Rd E
- 430 E Canyon Rd
- 760 E 700 St S
- 155 W Center St
- 351 W 100 South St
- 310 S 500 West Rd
- 75 N 100 West St
- 70 N 400 West Rd
- 225 W 200 St N
- 775 E Valley View Rd
- 750 800 South Fillmore
- 825 800 South Fillmore
Your Personal Tour Guide
Ask me questions while you tour the home.